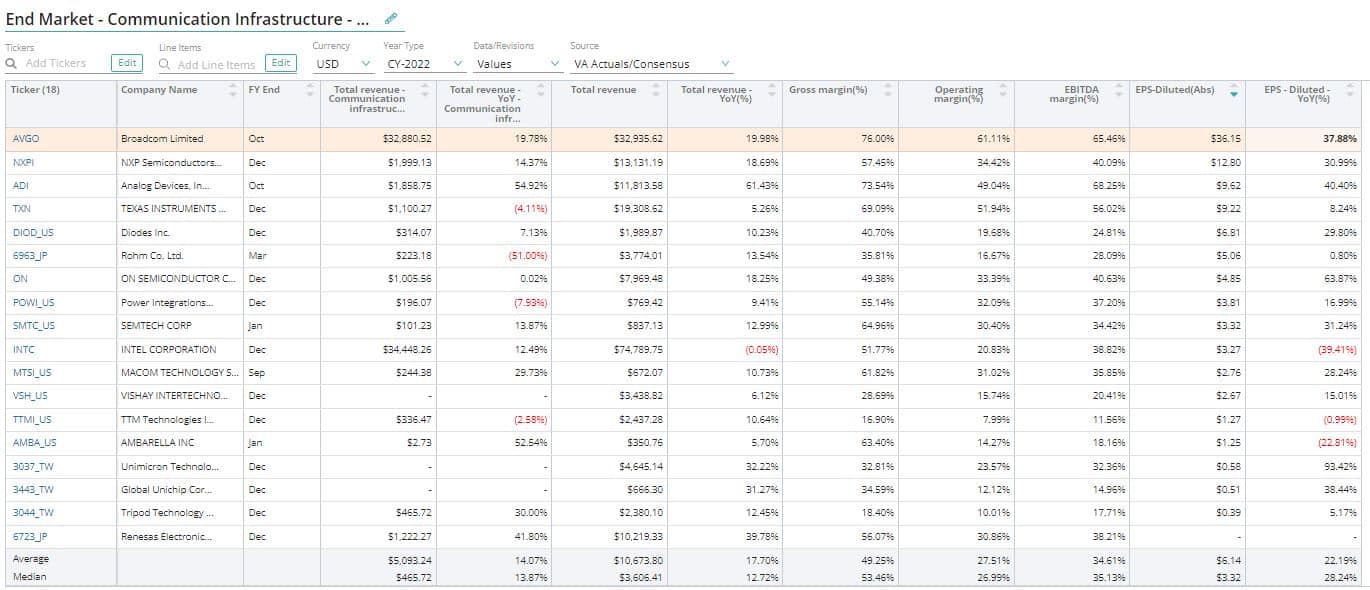
Gross margin is calculated by dividing gross profit by total revenue. It is a good indicator of margin leverage, particularly for companies with high fixed expenses. Furthermore, the higher the gross margin, the more money a corporation keeps, which it can utilize to cover other expenses or pay off debt.
Key performance indicators (KPIs) are the most important business metrics for a particular industry. When understanding market expectations for semiconductors, whether at a company or industry level, some semiconductor KPIs to consider include:
Semiconductor Industry
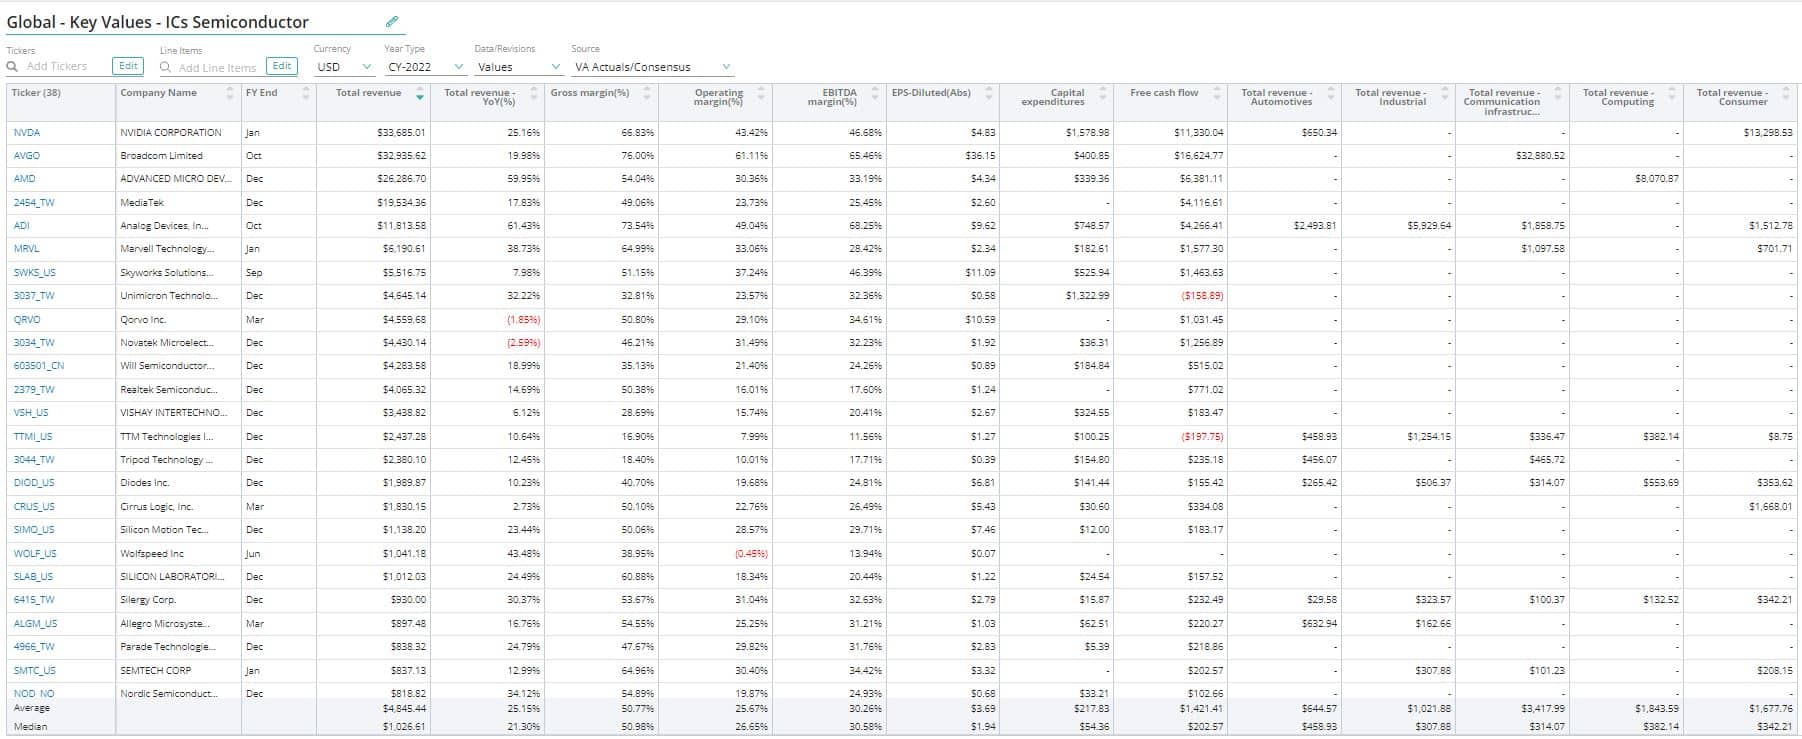
Semiconductor (Including Fabrication, Broadline & ICs, and Other Semiconductors)
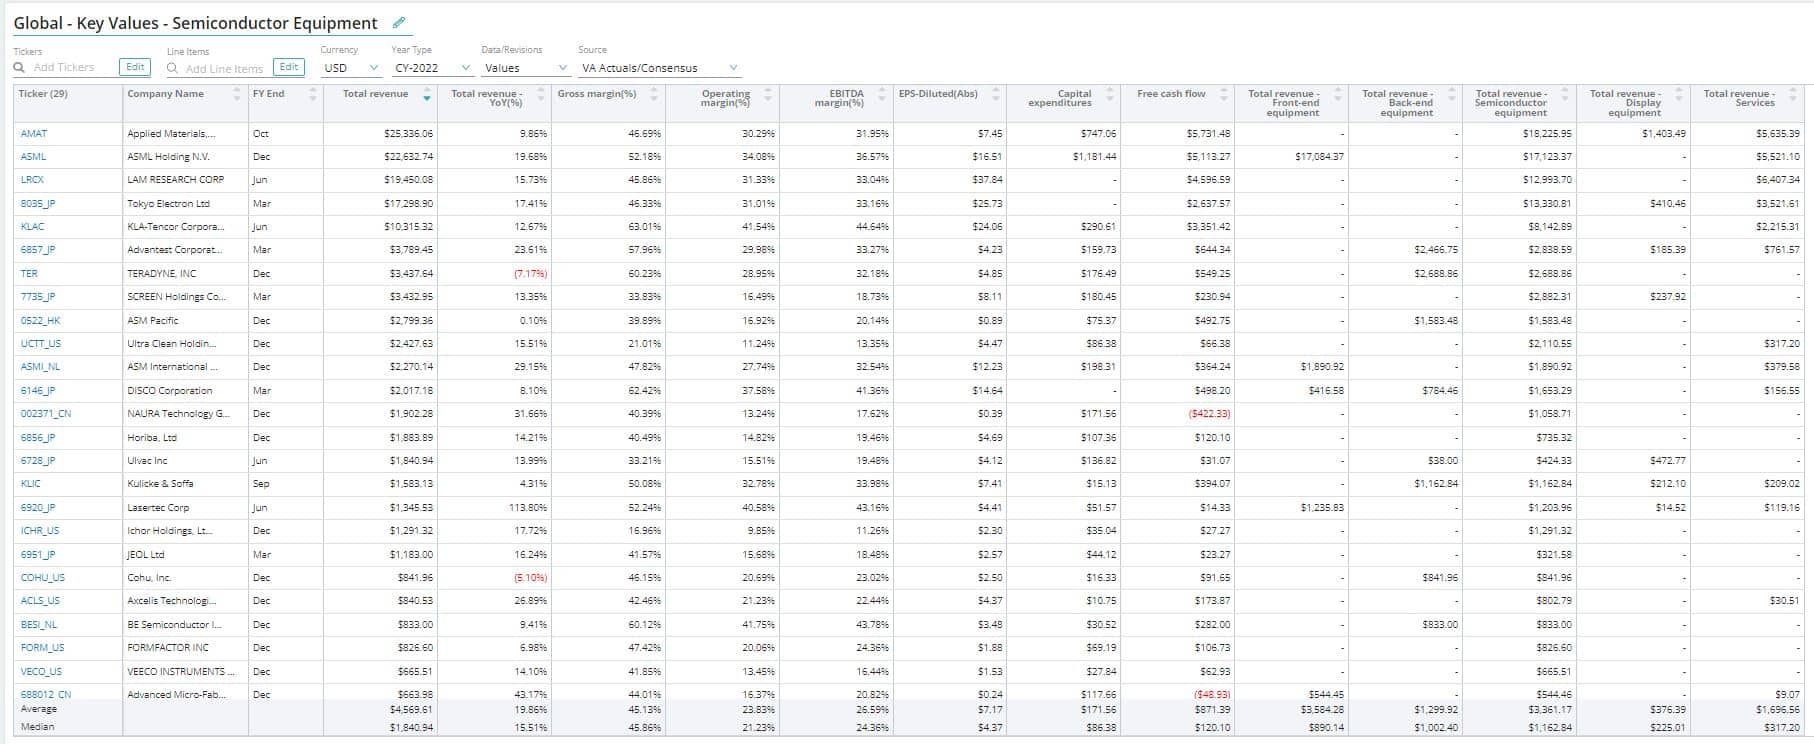
Semiconductor Equipment
Memory, Storage & Peripheral
Visible Alpha’s Standardized Industry Metrics
To understand market expectations for the semiconductor industry, a key information source is sell-side analyst estimates and consensus forecast data. The buy-side, sell-side, and public companies leverage this type of data to conduct competitive analysis, a type of analysis conducted by professional analysts that involves comparing standardized metrics of one company with those of similar companies. Because companies report metrics differently – and sometimes report on different metrics altogether – standardizing the key metrics for each company can be a cumbersome process.
Visible Alpha Insights includes analyst data, company data, and industry data at a level of granularity unparalleled in the market. Our industry data – Standardized Industry Metrics – enables market participants to quantify and compare market expectations for companies across 150+ industries.
Data as of January 2023
Industry KPI Terms & Definitions
Visible Alpha offers an innovative, integrated experience through real-time, granular consensus estimates and historical data created directly from the world’s leading equity analysts. Using a subset of the below KPIs, this data can help investors hone in on the key drivers of companies to uncover investment opportunities.
Gross Margin
Gross margin is calculated by dividing gross profit by total revenue. It is a good indicator of margin leverage, particularly for companies with high fixed expenses. Furthermore, the higher the gross margin, the more money a corporation keeps, which it can utilize to cover other expenses or pay off debt.
Capex To Sales
Capex to sales ratio compares a company’s total sales to its investments in property, plant, equipment, and other capital assets. The ratio demonstrates how aggressively a semiconductor company reinvests its revenue into productive assets.
Debt to EBITDA
The debt to EBITDA ratio compares a company’s overall commitments, including debt and other liabilities, to the real cash it generates and exposes whether or not the company is capable of paying its debt and other liabilities. When lenders and analysts look at a company’s debt to EBITDA ratio in the semiconductor industry, they are trying to figure out how well the company can pay off its loans.
Inventory Turnover Ratio
Inventory turnover ratio reflects a company’s ability to convert inventory into sales. The ratio also indicates whether management is effectively controlling inventory expenditures and whether they are purchasing too much or too little inventory. This ratio is calculated as the cost of goods sold (COGS) divided by the average inventory for the same period.
Return On Average Assets
Return on average assets assesses the efficiency with which a company generates revenue from its assets, machinery, and equipment. This is a crucial ratio to track because semiconductor companies rely largely on assets to generate income. It is calculated as net income divided by the average total assets. The greater this ratio is, the better because it indicates that the company is making more money with its working capital and net assets.
Semiconductor
Wafer
A wafer is a thin slice of semiconductor material, such as crystalline silicon, used in the fabrication of integrated circuits (ICs)generally used in electronics.
Total Wafers Revenue
Total wafer revenue is the revenue generated from wafer fabrication and finished semiconductor wafers.
Wafer Capacity
Wafer capacity is a company’s maximum level of output in terms of manufacturing and delivering wafers. Capacity available in the Company Data set on our Insights platform includes 6 inches (150mm), 8 inches (200mm), and 12 inches (300mm), which are further standardized to 8-inch equivalent and 12-inch equivalent in the fabrication industry.
Average Selling Price (ASP)
Average selling price (ASP) is the price at which a wafer is generally sold. Wafer prices are generally determined by the technology used in manufacturing and the size of the wafer, along with the market demand for chips.
Capacity Utilization Rate (%)
Capacity utilization rate measures the percentage of a company’s potential output that is realized. The capacity utilization rate of a company can be measured to see how effectively it is achieving its full potential.
Shipment
Shipment is the volume of products (such as wafers and ICs) offered to a carrier at the point of origin for transportation to pre-defined delivery locations in the value chain.
Outsourced Semiconductor Assembly And Test (OSAT)
Outsourced semiconductor assembly and test (OSAT) are companies that provide third-party IC-packaging and test services. These businesses package and test silicon devices created by foundries before they are released to the market.
Total OSAT Revenue
Total OSAT revenue is revenue generated from rendering services such as assembly, packaging, and testing by OSATs.
Total Automotive Revenue
Total automotive revenue is the revenue generated by a semiconductor company from automotive semiconductors. This includes revenue generated from products used in LiDAR sensors, camera-based sensors, Matrix LEDs in electric vehicles, and 3-D mapping technology, among others.
Total Industrials Revenue
Total industrial revenue is the revenue generated by a semiconductor company from industrial semiconductors that are used in manufacturing systems, medical equipment, factory and building control, security, and energy management among others.
Total Communication Infrastructure Revenue
Total communication infrastructure revenue is the revenue generated by a semiconductor company from semiconductors used in communication infrastructure such as networking hardware, wireless infrastructure (radios, cellular base stations, and mobile backhaul), local area networks (LAN and WLAN), and DSL/cable/fiber among others.
Total Consumer Revenue
Total consumer revenue is the revenue generated by a semiconductor company from semiconductors used in consumer electronics products.
Total Computing Revenue
Total computing revenue is the revenue generated by a semiconductor company from semiconductors used in desktops, laptops, and servers. This includes microprocessors, graphics chips (GPUs), and other analog chips.
Total Data Center Revenue
Total data center revenue is the revenue generated from data centers. A data center service is an environment that allows data to be processed, networked, and stored. Infrastructure, cloud hosting, networks, consulting, and virtualization are the different segments of the data center services market.
Semiconductor Equipment
Total Front-end Equipment Revenue
Total front-end equipment revenue is the revenue generated from front-end semiconductor manufacturing. Front-end equipment is the equipment used in front-end manufacturing processes. The process of manufacturing a wafer is referred to as front-end semiconductor manufacturing.
Total Back-end Equipment Revenue
Total back-end equipment revenue is the revenue generated from back-end semiconductor manufacturing. Back-end equipment includes the machinery required for the assembly, packaging, and testing of integrated circuits (ICs).
Total Lithography Revenue
Total lithography revenue is revenue generated from selling lithography machines. Semiconductor lithography, also known as photolithography, is one of the most common methods of fabricating integrated circuits.
Memory, Storage & Peripheral
Bits
In computing and digital communications, the bit is the most fundamental unit of data. A logical state with one of two potential values is represented by a bit. The most frequent representations for these values are “1” and “0,” but additional representations such as true/false, yes/no, +/, and on/off are also prevalent.
Bit Shipments – DRAM
Bits shipment – DRAM is the number of DRAM bits transferred from B2B and B2C.
Bit Shipments – NAND
Bits shipment – NAND is the number of NAND bits transferred from B2B and B2C.
Cost Per Bit
Cost per bit is simply the monetary cost (in dollars and cents) per unit of memory, i.e. assuming the quantity of memory required stays the same.
Average Selling Price (ASP)
The average selling price (ASP) is the price at which goods or services are usually sold. DRAM, NAND, and HDD are the products for which ASPs are available in the semiconductor industry.
Total DRAM Revenue
Total DRAM revenue is the revenue generated from the sale of DRAM. DRAM, short for dynamic random access memory, is a type of volatile storage technology, not suitable for long-term data storage. It is, nevertheless, quick and inexpensive, and thus extensively used for storing temporary data generated by any calculation.
Total NAND Flash Revenue
Total NAND flash revenue is the revenue generated from the sale of NAND flash products. NAND flash memory is a type of non-volatile storage technology, capable of storing data permanently. It is not as speedy as DRAM, but has a simpler intrinsic structure, making it easier to make and less costly than DRAM. As a result, NAND is a more popular memory technology for data storage.
Total HDD Revenue
Total HDD revenue is the revenue generated from HDD storage products. Storage is a component of a computer that enables the long-term storage and access of data. Storage is usually in the form of a solid-state drive (SSD) or a hard disc drive (HDD).
Total Cloud Solutions Revenue
Total cloud solutions revenue is the revenue generated from cloud solutions. Cloud solutions involve rendering services via the internet. This includes data storage, servers, databases, networking, and software, among other tools and applications. Infrastructure-as-a-Service (IaaS), Platform-as-a-Service (PaaS), and Software-as-a-Service (SaaS) are the three main categories.
Download this guide as an ebook today:
Guide to Semiconductor KPIs for Investment Professionals
This guide highlights the key performance indicators for the semiconductor industry and where investors should look to find an investment edge, including:
- Semiconductor Business Model & Diagram
- Key Semiconductor Industry Metrics PLUS Visible Alpha’s Standardized Industry Metrics
- Available Comp Tables
- Industry KPI Terms & Definitions


