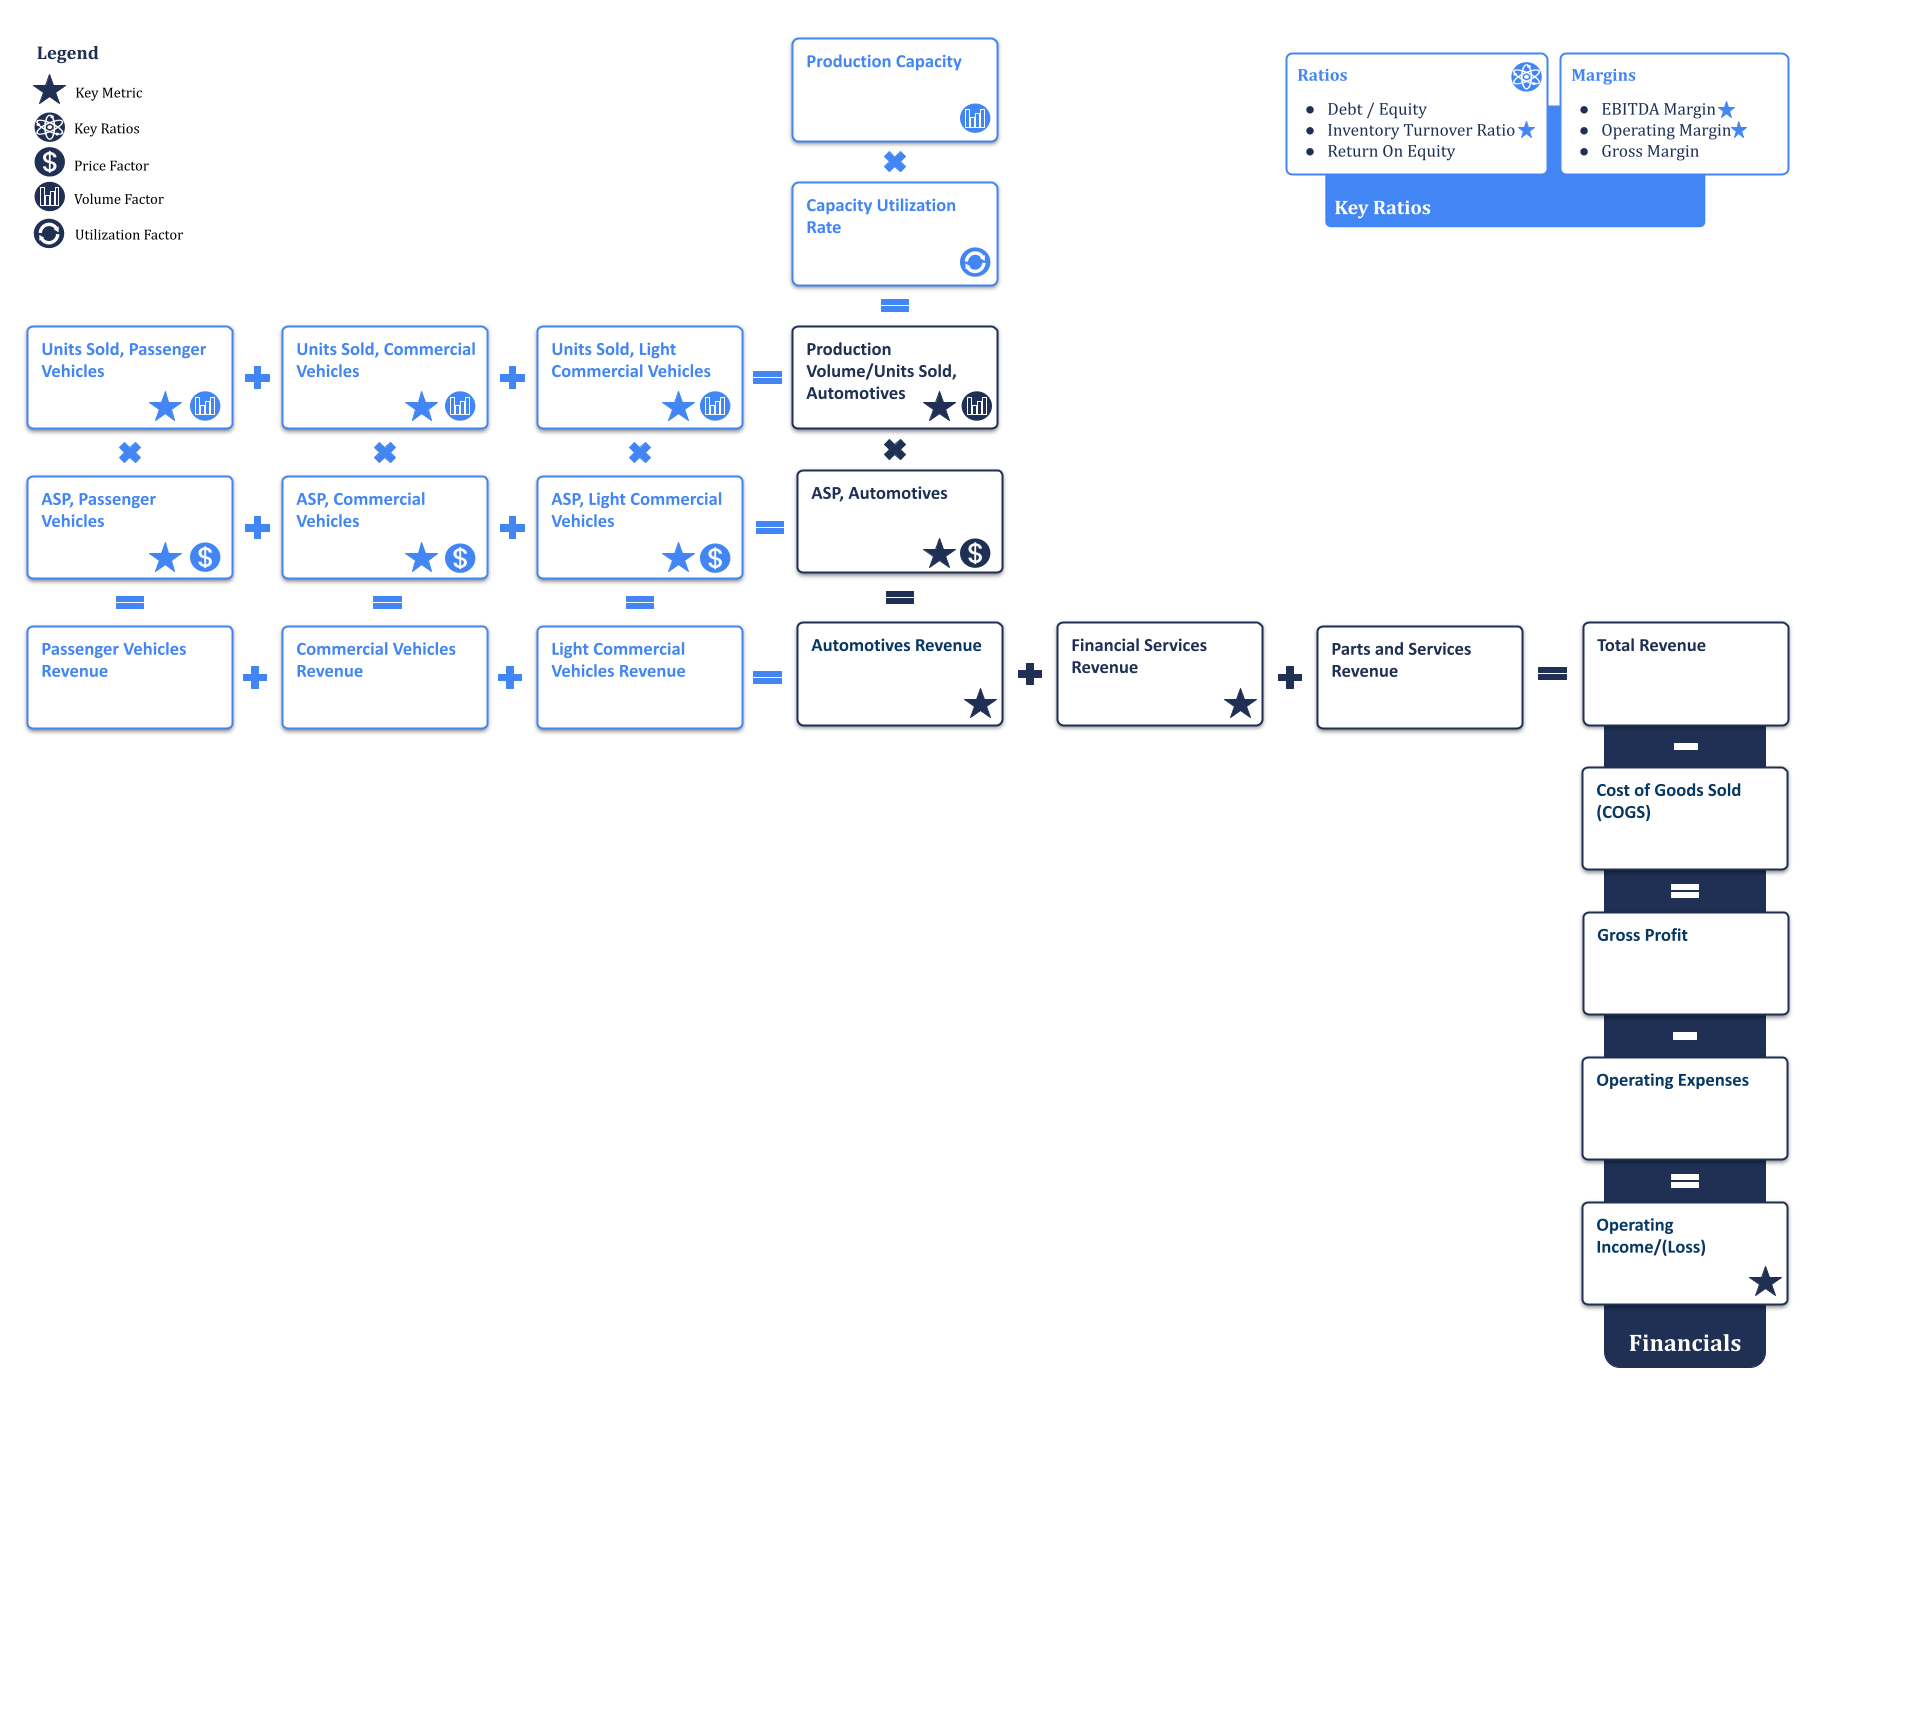
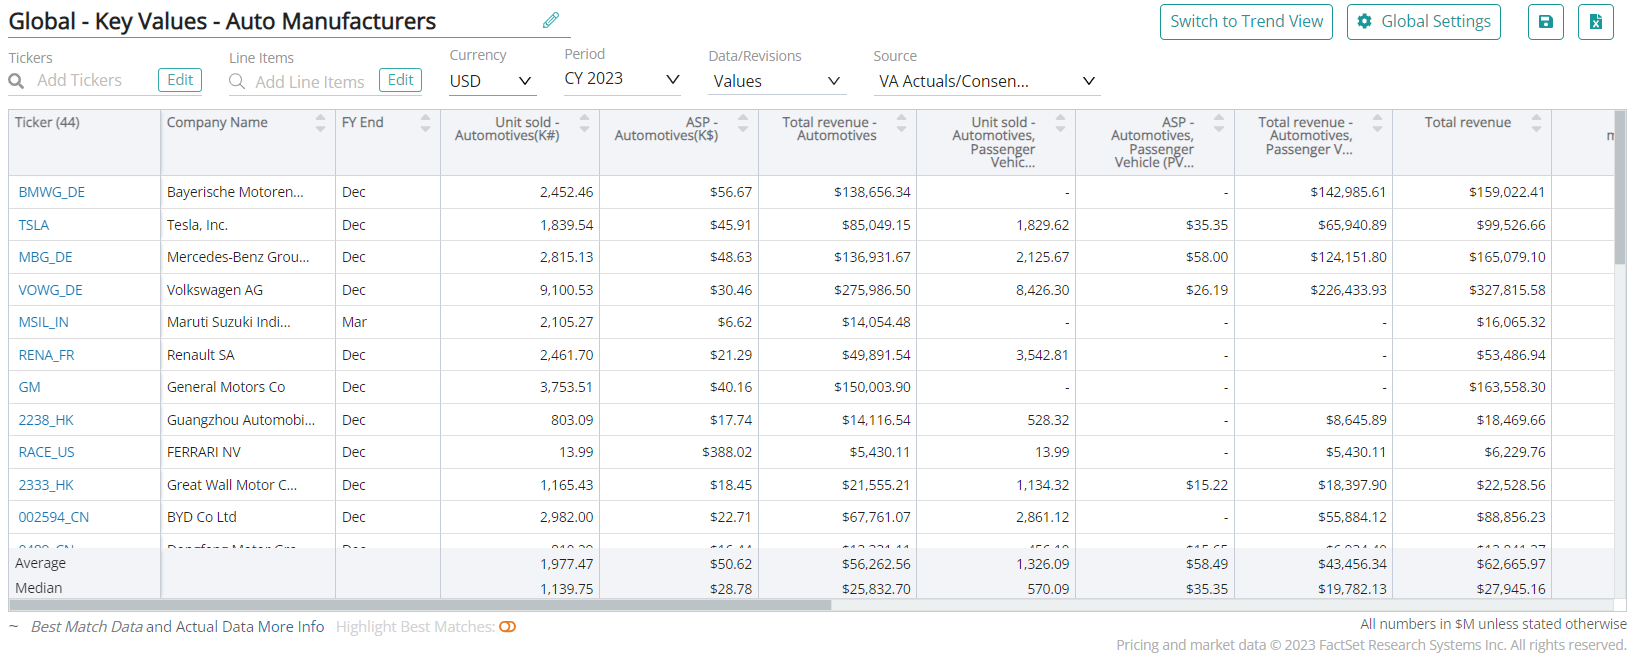
Units sold – Automotives, is the number of passenger and commercial vehicles sold within a given period. This metric is used to track the performance of automotive manufacturers and dealerships in terms of their sales volume.
Key performance indicators (KPIs) are an industry’s most important business metrics. When understanding market expectations for the auto manufacturing industry, whether at a company or industry level, some KPIs to consider include:
Visible Alpha’s Standardized Industry Metrics
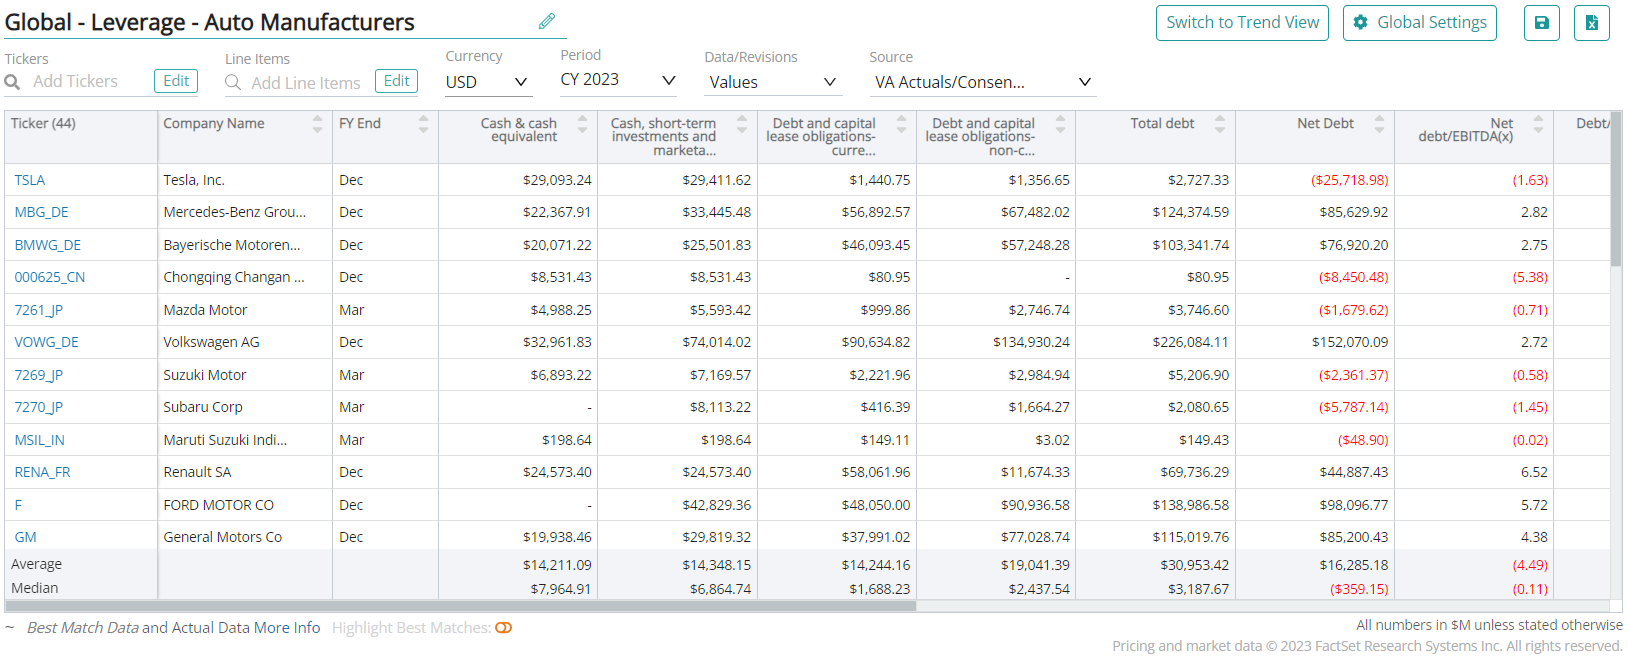
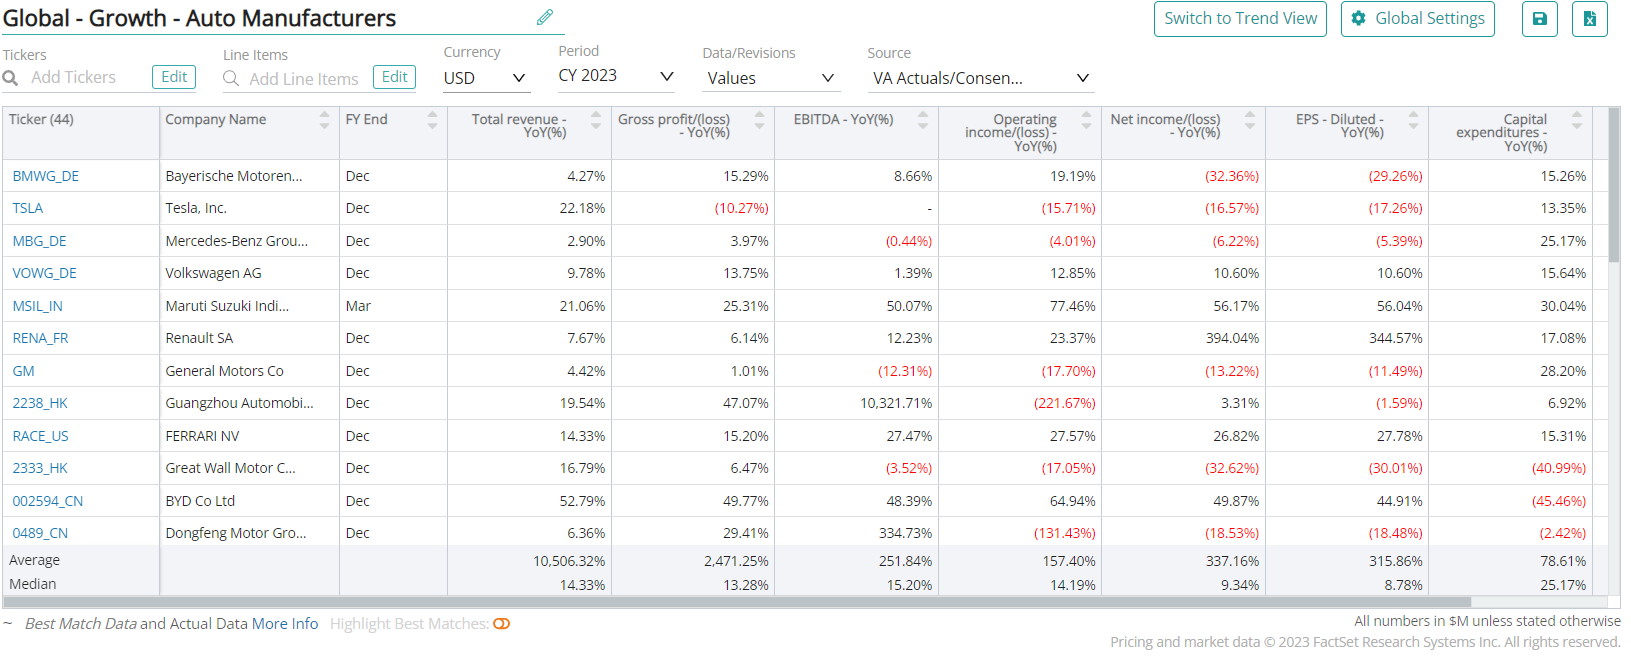
To understand market expectations for the auto manufacturing industry, a key information source is sell-side analyst estimates and consensus forecast data. The buy-side, sell-side, and public companies leverage this type of data to conduct competitive analysis, a type of analysis conducted by professional analysts that involves comparing standardized metrics of one company with those of similar companies. Because companies report metrics differently – and sometimes report on different metrics altogether – standardizing the key metrics for each company can be a cumbersome process.
Visible Alpha Insights includes analyst data, company data, and industry data at a level of granularity unparalleled in the market. Our industry data – Standardized Industry Metrics – enables market participants to quantify and compare market expectations for companies across 150+ industries.
Data as of June 2023
Industry KPI Terms & Definitions
Visible Alpha offers an innovative, integrated experience through real-time, granular consensus estimates and historical data created directly from the world’s leading equity analysts. Using a subset of the below KPIs, this data can help investors hone in on the key drivers of companies to uncover investment opportunities. Learn More >
EBITDA – Automotives
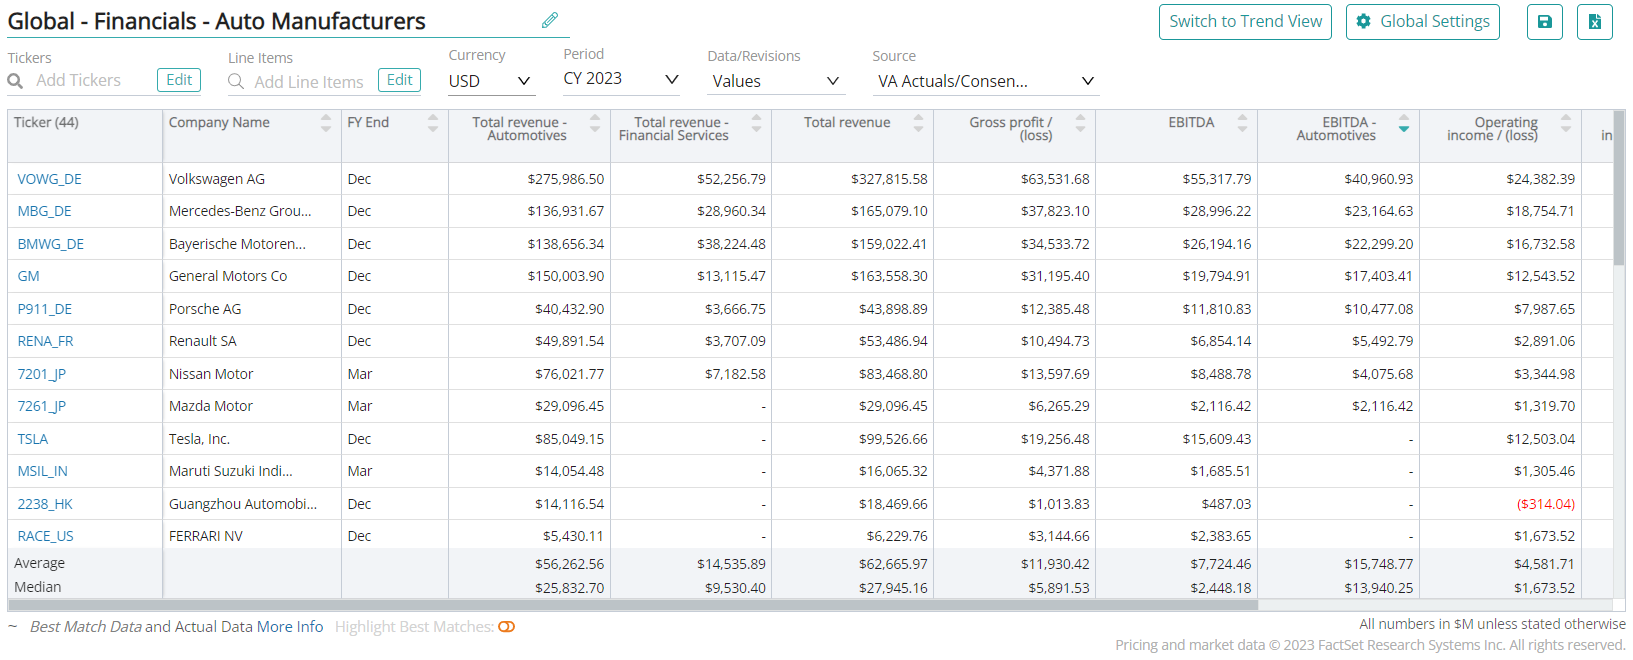
EBITDA (earnings before interest, taxes, depreciation, and amortization) measures a company’s operating performance by subtracting operating expenses from revenue, without taking into account interest, taxes, depreciation, and amortization expenses. For auto manufacturers, EBITDA is often used as a key performance indicator because it provides a more focused view of a company’s operating performance, by removing the effects of non-operating and non-cash expenses.
Operating Income/(Loss) – Automotives
Operating income/(loss) – Automotive provides a measure of the profitability of an automotive business, which includes the production, distribution, and sale of vehicles. Operating income provides a measure of a company’s profitability from its core operations.
EBITDA Margin
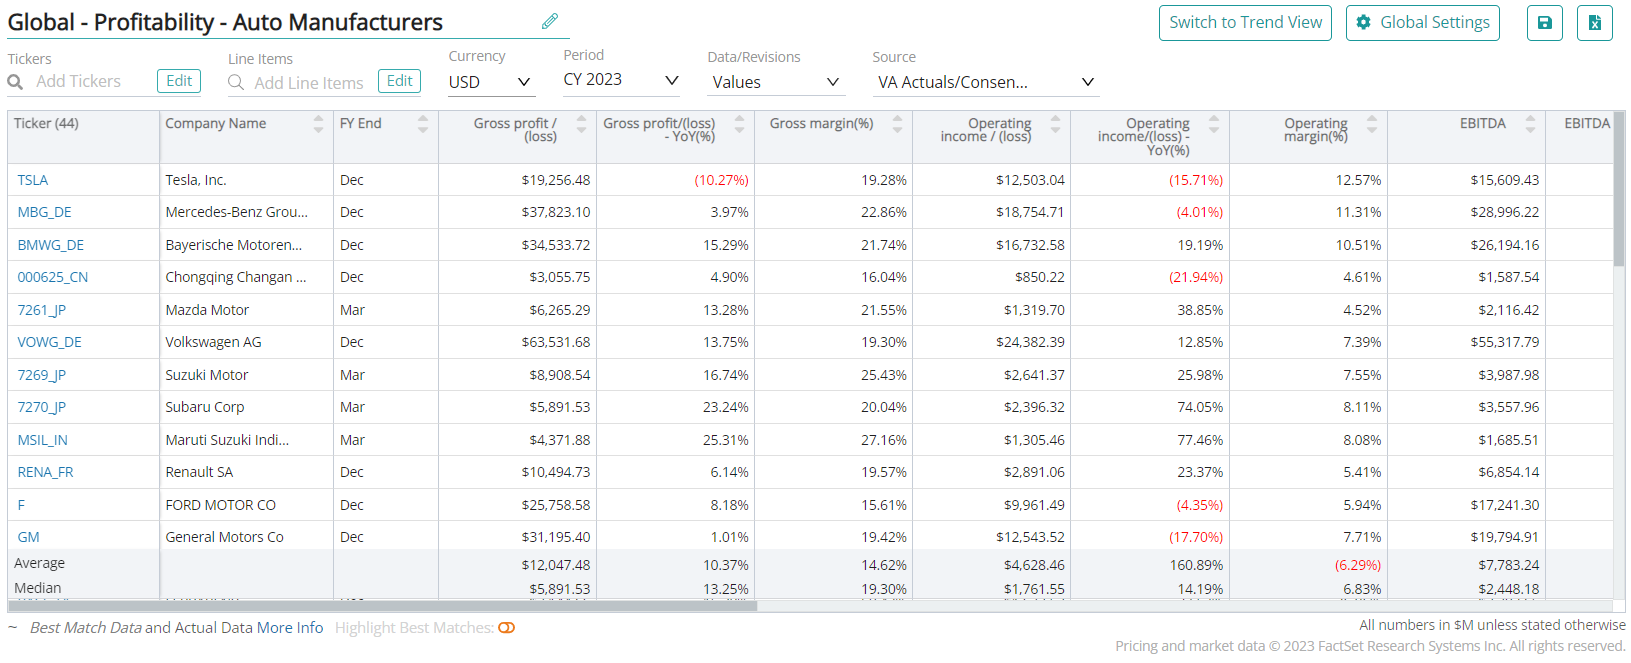
EBITDA margin helps assess the profitability and operational efficiency of auto manufacturers. It measures the proportion of a company’s revenue that is converted into earnings before interest, taxes, depreciation, and amortization (EBITDA). EBITDA margin is calculated by dividing EBITDA by total revenue and expressing the result as a percentage.
Gross Margin
Gross margin measures the profitability of auto manufacturers in the initial stage of production. It represents the proportion of revenue remaining after deducting the direct costs associated with producing vehicles.
Operating Margin
Operating margin or EBIT margin measures the profitability of auto manufacturers’ core operations, after deducting operating expenses.
Debt / Equity
Debt / Equity is used to assess the relative proportion of debt and equity financing used by auto manufacturers. It is calculated by dividing the total debt of a company by its total equity. A higher debt-to-equity ratio indicates a higher proportion of debt, which may imply higher financial leverage and risk. While a lower debt-to-equity ratio suggests a larger proportion of equity financing, which may indicate a more conservative financial position.
Days Inventory Outstanding (DIO)
Days inventory outstanding (DIO) is the average number of days it takes for a company to sell its inventory. To calculate DIO, you divide the average inventory by the cost of goods sold (COGS), and then multiply the result by the number of days in a given period.
Inventory Turnover Ratio
Inventory turnover ratio measures how many times a company sells and replaces its inventory in a given period. It is calculated by dividing the cost of goods sold (COGS) by the average inventory in a given period. It is used to measure the efficiency of a company’s inventory management.
Return On Equity
Return on equity (ROE) is calculated by dividing the net income of the company by its average shareholders’ equity. ROE measures the profitability and efficiency of a company in generating profits from the shareholders’ equity investment.
Capacity Utilization
Capacity utilization refers to the extent to which an auto manufacturing company utilizes its production capacity to produce vehicles.
Production Volume
Production volume refers to the total quantity or number of vehicles manufactured or produced by an auto manufacturing company within a specific period.
Units Solds – Automotives, Passenger Vehicles
Units sold – Automotives, Passenger Vehicles are the number of passenger vehicles sold within a given period. Passenger vehicles include hatchbacks, sedans, and SUVs.
Units Solds – Automotives, Commercial Vehicles
Units sold – Automotives, Commercial Vehicles are the number of commercial vehicles sold within a given period. Commercial vehicles include mini-trucks, minivans, and cargo trucks, among others.
Units Solds – Automotives
Units sold – Automotives, is the number of passenger and commercial vehicles sold within a given period. This metric is used to track the performance of automotive manufacturers and dealerships in terms of their sales volume.
ASP – Automotives, Passenger Vehicles
ASP – Automotives, Passenger vehicles refers to the average selling prices of passenger vehicles. ASP is calculated by dividing the total revenue generated by the sales of passenger vehicles by the total number of passenger vehicles sold during a given period.
ASP – Automotives, Commercial Vehicles
ASP – Automotives, Commercial vehicles refers to the average selling prices of commercial vehicles. ASP is calculated by dividing the total revenue generated by the sales of commercial vehicles by the total number of commercial vehicles sold during a given period.
ASP – Automotives
ASP – Automotives refers to the average selling prices of passenger and commercial vehicles. ASP is calculated by dividing the total revenue generated by the sales of passenger and commercial vehicles by the total number of passenger and commercial vehicles sold during a given period.
Total Revenue – Automotives, Passenger Vehicles
Total revenue – Automotives, Passenger vehicles refer to the total revenue generated from the sales of passenger vehicles during a given period. This includes the revenue generated from selling all types of passenger vehicles, such as hatchbacks, sedans, and SUVs.
Total Revenue – Automotives, Commercial Vehicles
Total revenue – Automotives, Commercial vehicles refer to the total revenue generated from the sales of commercial vehicles during a given period. This includes the revenue generated from selling all types of commercial vehicles, such as minivans and trucks.
Total Revenue – Automotives
Total revenue – Automotives refers to the total revenue generated from the sales of both passenger and commercial vehicles during a given period. This metric helps compare the performance of different auto manufacturers and analyze their market share, as well as identify trends in the industry.
Total Revenue – Financial Services
Total revenue – Financial services refer to the revenue generated from providing financing, leasing, and other financial services related to the sale of vehicles. This revenue is often reported separately from the revenue generated from the sale of vehicles themselves.
Download this guide as an ebook today:
Guide to Auto Manufacturing Industry KPIs for Investment Professionals
This guide highlights the key performance indicators for the auto manufacturing industry and where investors should look to find an investment edge, including:
- Auto Manufacturing Industry Business Model & Diagram
- Key Auto Manufacturing Metrics PLUS Visible Alpha’s Standardized Industry Metrics
- Available Comp Tables
- Industry KPI Terms & Definitions

