Gross profit margin measures the percentage of revenue that exceeds the cost of goods sold (COGS)
Key performance indicators (KPIs) are the most important business metrics for a particular industry. When understanding market expectations for the oil & gas equipment & services industry, whether at a company or industry level, some KPIs to consider include:
Visible Alpha’s Standardized Industry Metrics
To understand market expectations for the oil & gas equipment & services industry, a key information source is sell-side analyst estimates and consensus forecast data. The buy-side, sell-side, and public companies leverage this type of data to conduct competitive analysis, a type of analysis conducted by professional analysts that involves comparing standardized metrics of one company with those of similar companies. Because companies report metrics differently – and sometimes report on different metrics altogether – standardizing the key metrics for each company can be a cumbersome process.
Visible Alpha Insights includes analyst data, company data, and industry data at a level of granularity unparalleled in the market. Our industry data – Standardized Industry Metrics – enables market participants to quantify and compare market expectations for companies across 150+ industries.
Data as of April 23, 2024
Industry KPI Terms & Definitions
Visible Alpha offers an innovative, integrated experience through real-time, granular consensus estimates and historical data created directly from the world’s leading equity analysts. Using a subset of the below KPIs, this data can help investors hone in on the key drivers of companies to uncover investment opportunities.
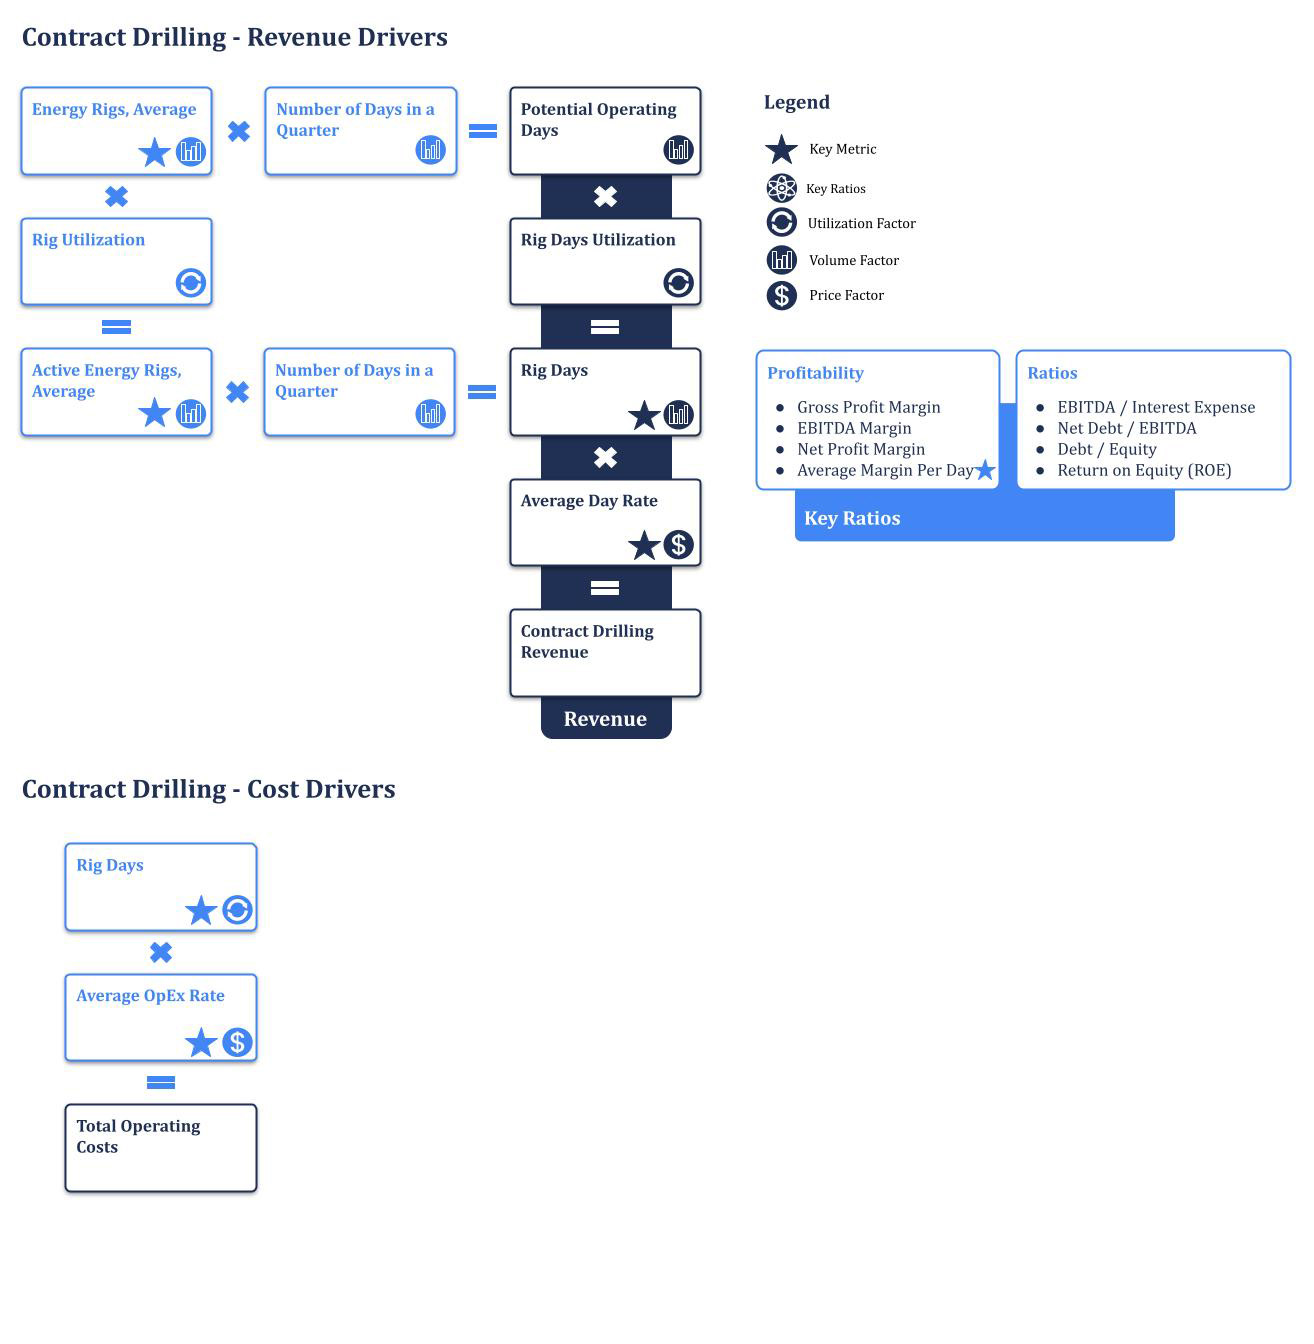
Rigs
An oil rig is a large structure used in the exploration and extraction of oil and natural gas from beneath the Earth’s surface. These rigs are typically located in oceans, seas, or lakes where petroleum deposits are found beneath the seabed.
Active Rigs
Active rigs refer to the number of drilling rigs that are currently operational and actively engaged in drilling for oil or natural gas.
Rig Utilization
Rig utilization is the percentage of time that a drilling rig is actively engaged in drilling or other operational activities compared to its total available time. It is calculated by dividing the number of active rigs (those in operation or actively working) by the total number of rigs available.
Revenue Per Rig
Revenue per rig is the amount of revenue generated by each drilling rig in a given period, typically calculated on a quarterly or annual basis. A higher revenue per rig typically indicates that the company is extracting more oil and gas from each drilling rig, which can be a sign of operational efficiency and profitability.
Day Utilization
Day utilization is the percentage of available days that a drilling rig is actively working or drilling during a specific period. It is calculated as the total number of days rigs are working (actual operating days) divided by the total number of days in a given period (potential operating days). A high day utilization rate indicates that the rig is in operation for a significant portion of the available days, suggesting strong demand for drilling services and active exploration and production activities.
Actual Operating Days
Actual operating days also known as rig days – contract drilling are the total number of days during a specific period that a drilling rig is actively engaged in drilling operations or other productive activities. It represents the total number of days a drilling rig actively earns revenue under a contractual agreement.
Potential Operating Days
Potential operating days refer to the total number of calendar days in the specified period, such as a month, quarter, or year. It is calculated as a product of the number of days in a month, quarter, or year, and the total number of rigs available for operations.
Average Day Rate
Average day rate refers to the average amount earned per day by a drilling rig under a contractual agreement.
Average Operating Cost Per Day
Average operating cost per day measures the average daily expenses incurred in operating a drilling rig. It represents the average amount of money spent per day to keep the rig operational and productive. It is calculated by dividing the total operating costs in a given period by the number of actual operating days in that period. This metric excludes operating costs that are reimbursed by customers, as well as rig construction costs.
Average Operating Margin Per Day
Average operating margin per day measures the average profit earned per day from operating a drilling rig. It is calculated by dividing the EBITDA from contract drilling during a given period by the number of actual operating days in that period.
Reimbursement Revenue
Reimbursement revenue is the income a company receives from its clients for purchasing equipment, supplies, personnel, and other services as requested by the clients. This revenue is recognized when the company incurs costs on behalf of the customer.
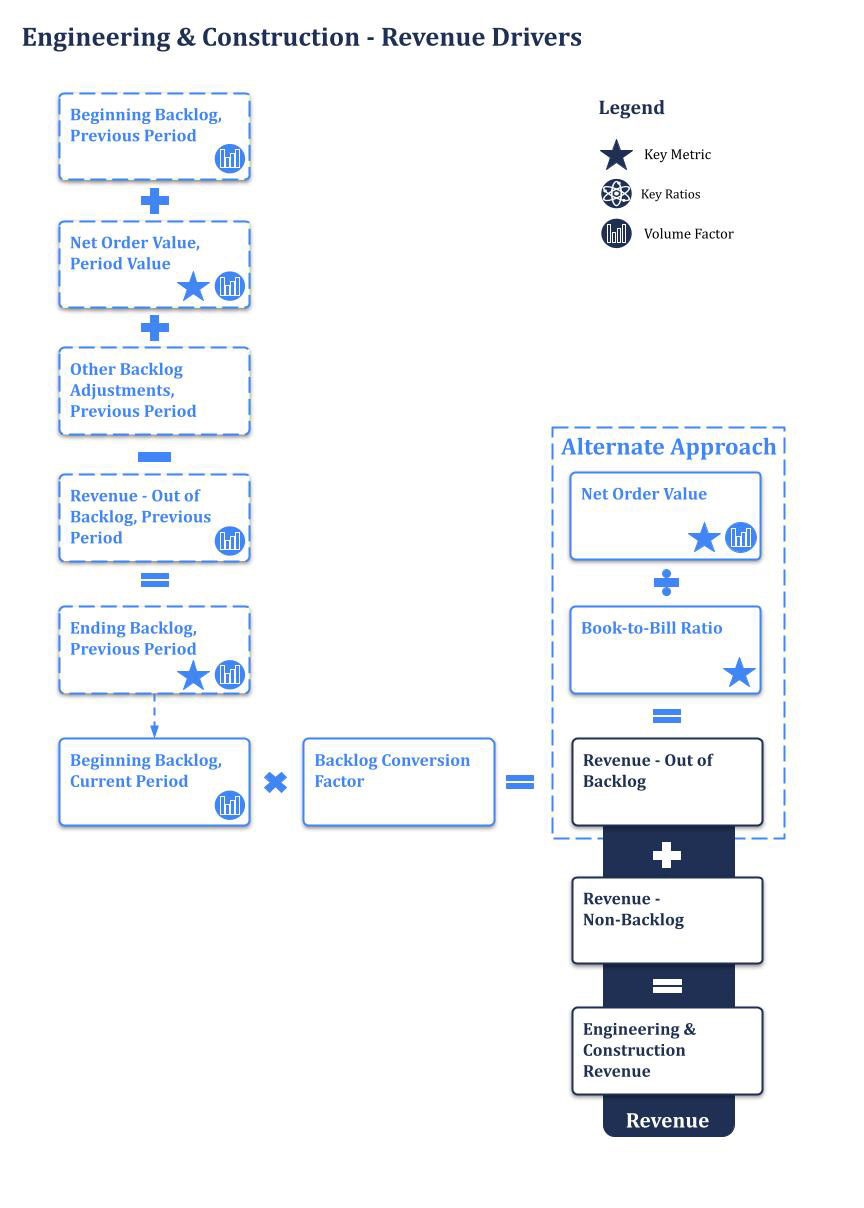
Net Order Value
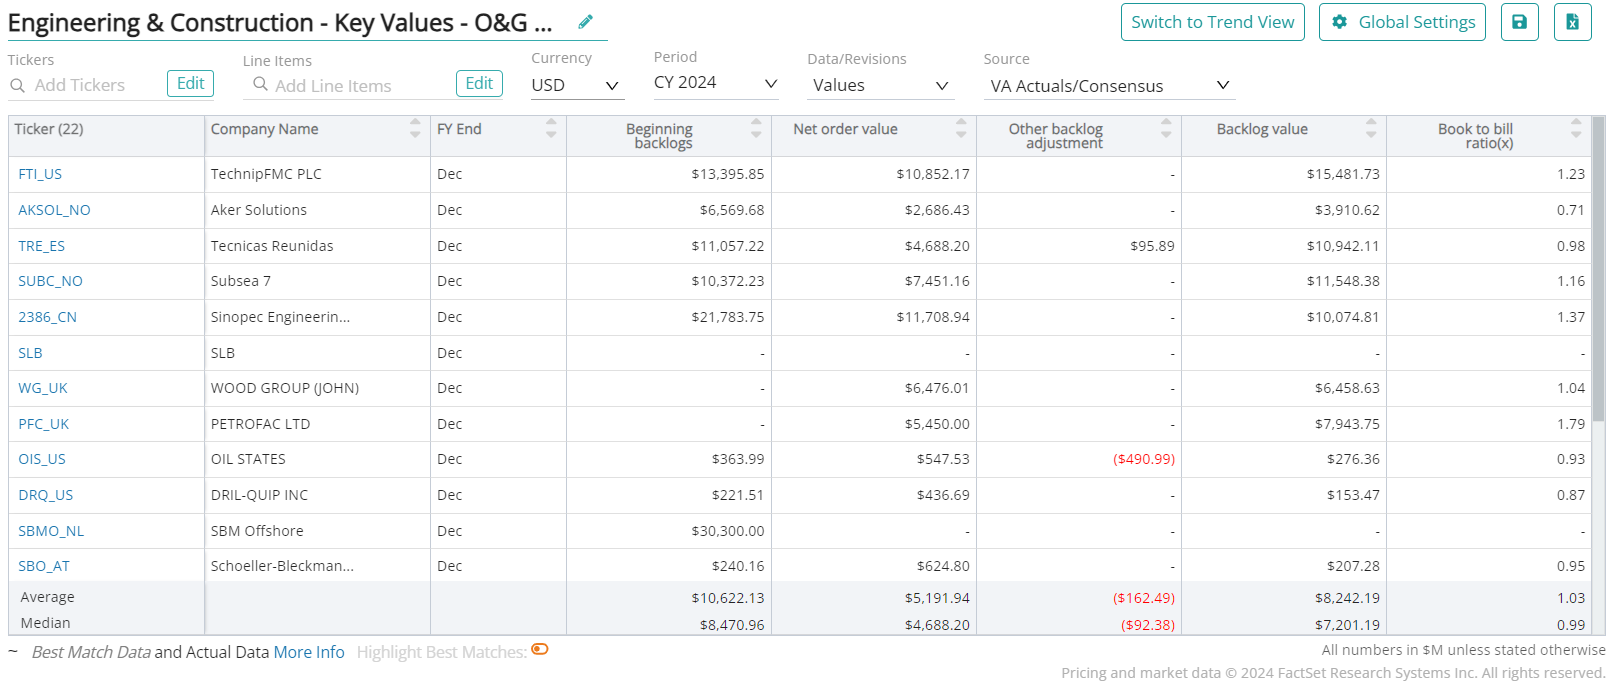
Net order value refers to the total value of orders that a company has received after deducting any cancellations, returns, or adjustments.
Backlog Value
Backlog refers to the total value of confirmed orders that a company has received but has not yet fulfilled or delivered. It represents the value of work that the company has committed to completing in the future.
Book-to-Bill Ratio
The book-to-bill ratio is a measure that compares the value of new orders a company receives for its goods and services to the amount it bills (or earns) over a specific period. It shows how much new business a company has acquired in comparison to the revenue it generated during that period.
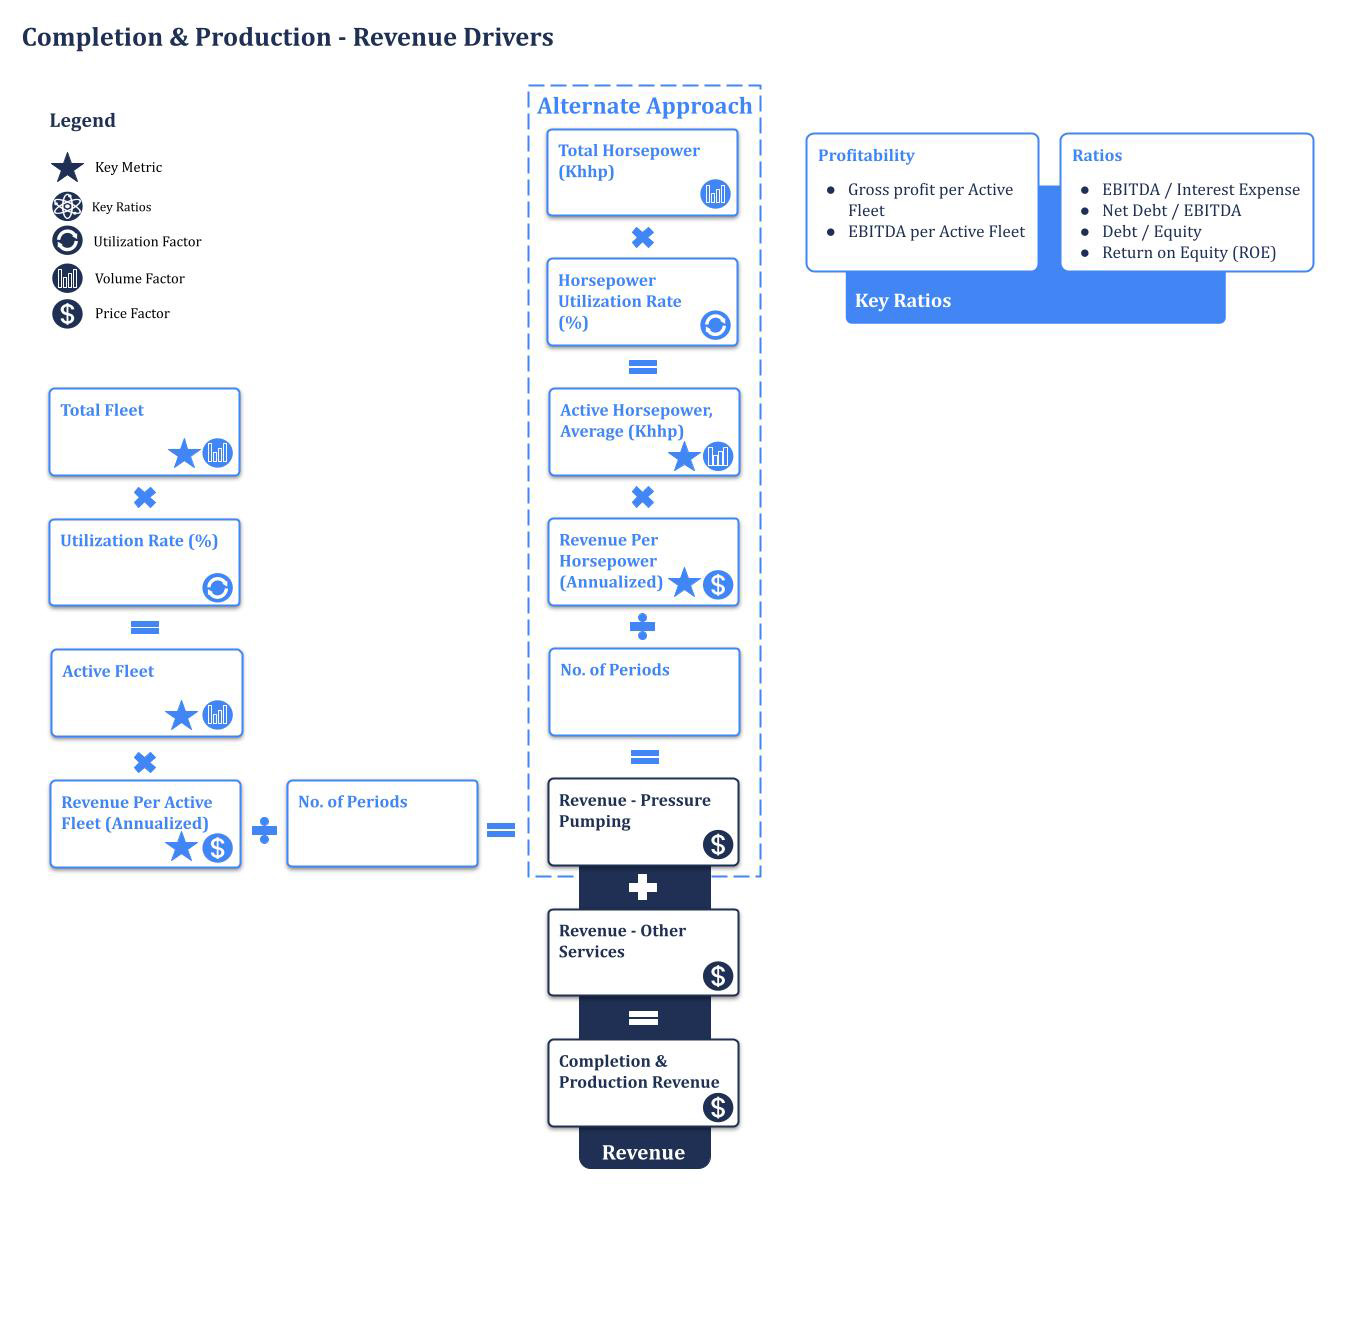
Active Fleets
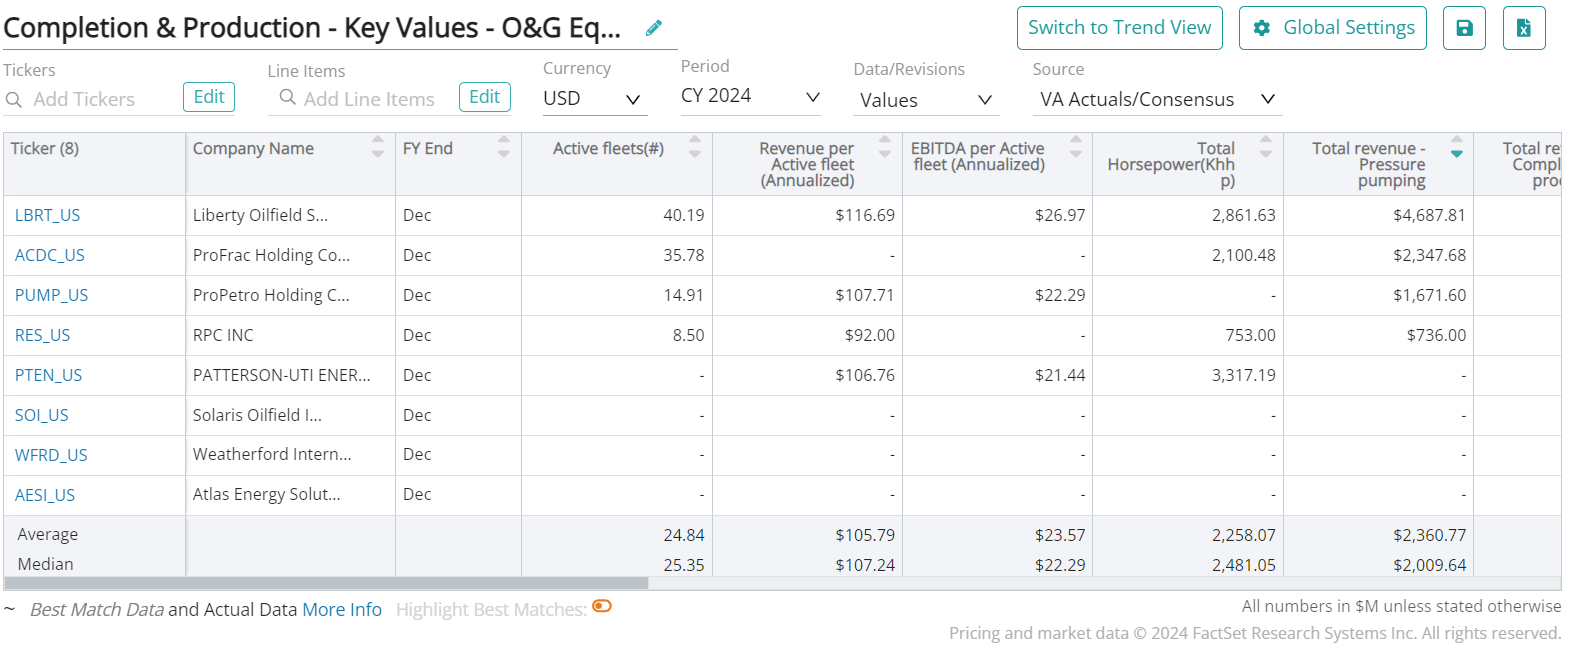
Active fleet refers to the number of operational assets or equipment units that a company has available for use at any given time. These assets can include drilling rigs, production platforms, vessels, well intervention equipment, seismic survey vessels, and other machinery used in oil and gas exploration, production, and transportation.
Total Fleet
Total fleet refers to the complete inventory of equipment and assets that a company owns or operates. This includes all machinery, vehicles, vessels, rigs, and other equipment that the company possesses, regardless of whether they are currently in use or not.
Revenue Per Active Fleet (Annualized)
Revenue per active fleet measures the amount of revenue that an operating fleet earns every year. It is computed as revenue from hydraulic fracturing or pressure pumping on an annual basis divided by active fleet.
EBITDA Per Active Fleet (Annualized)
EBITDA per active fleet indicates the average EBITDA generated by each active unit (such as a drilling rig, production platform, vessel, etc.) in a company’s operational fleet. It is computed as EBITDA from hydraulic fracturing or pressure pumping on an annual basis divided by the active fleet.
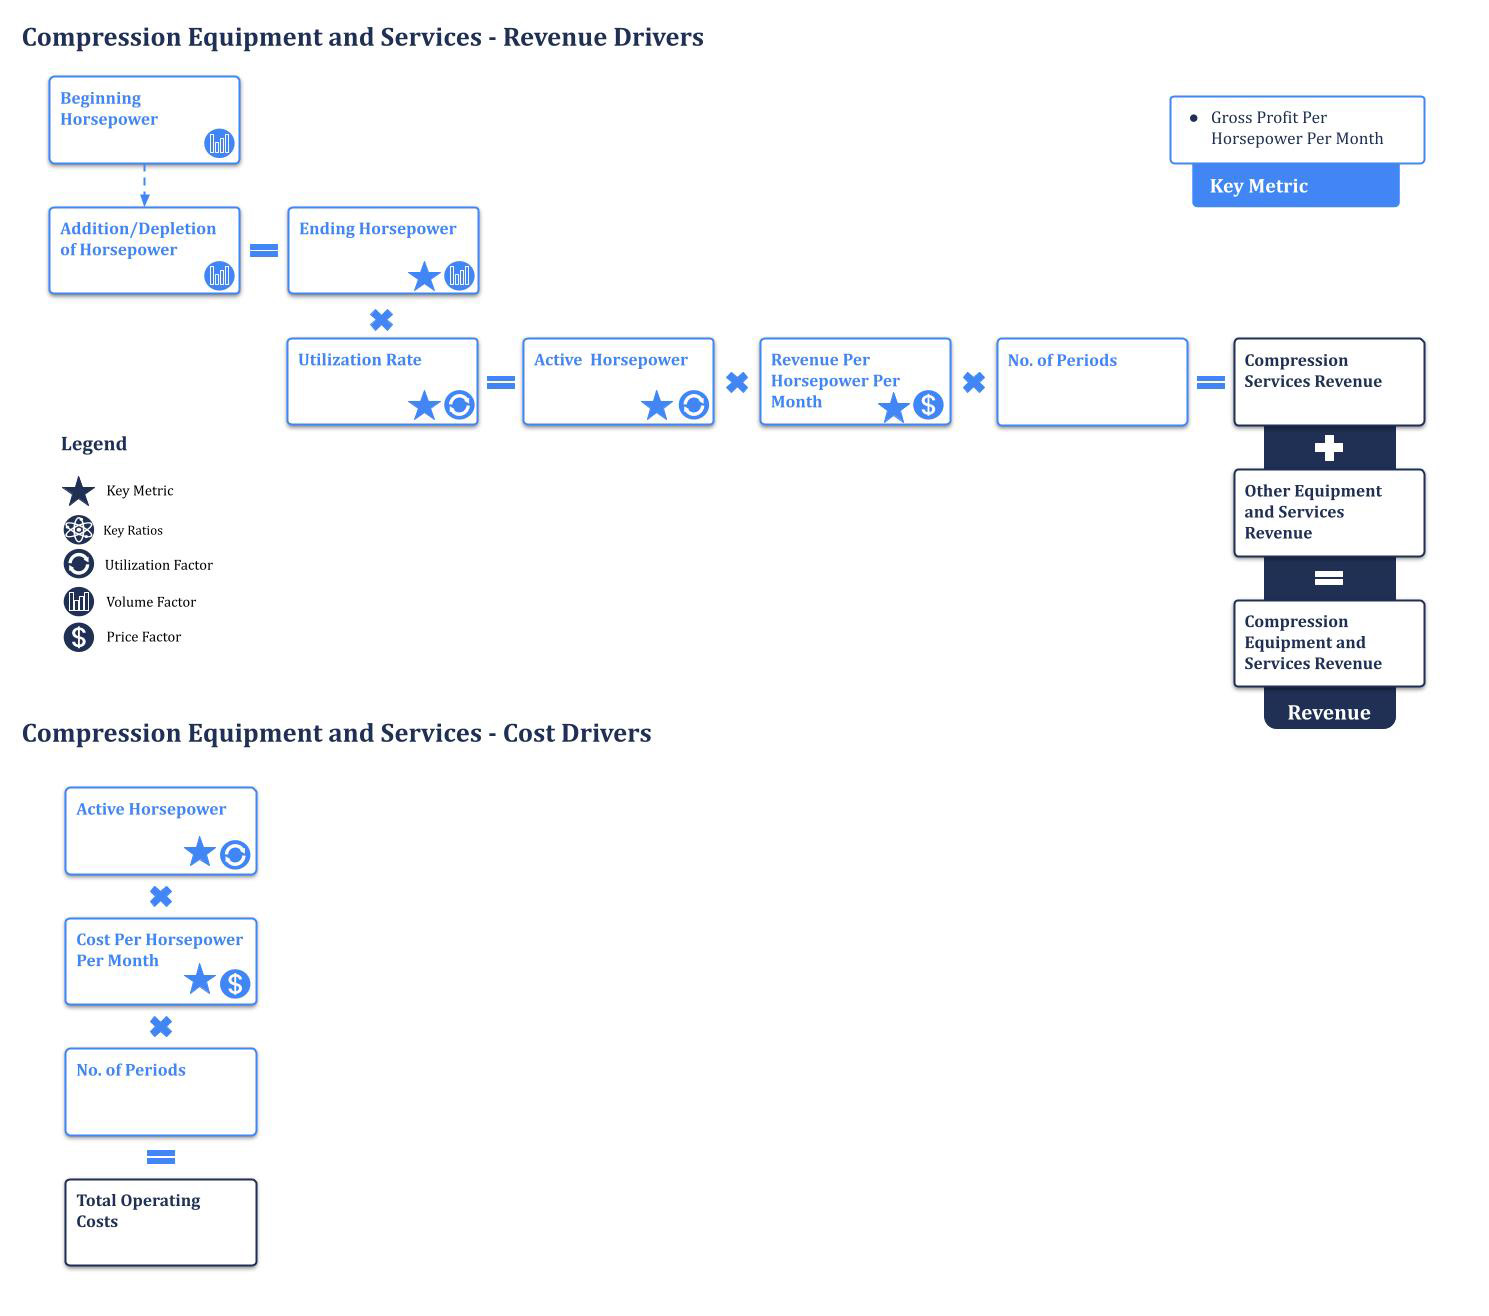
Active Horsepower, Average
Active horsepower refers to the total power output of the engines or motors that are currently in use or actively deployed in operations.
Total Horsepower, Average
Total horsepower refers to the combined power output of all the engines or motors used in a company’s equipment fleet. This metric is particularly important for companies that provide drilling, hydraulic fracturing (fracking), pumping, or other services that require significant power.
Horsepower Per Fleet
Horsepower per fleet measures the average power capacity of each unit within a company’s fleet of equipment. It is calculated as total horsepower divided by the number of units in a fleet.
Horsepower Utilization Rate
Horsepower utilization rate indicates the percentage of available horsepower or power capacity that is actively utilized in a system, process, operation, or fleet of equipment. It is calculated by dividing the actual horsepower being used in the operation by the total available horsepower and multiplying by 100 to express it as a percentage.
Revenue Per Horsepower (Annualized)
Revenue per horsepower calculates how much revenue a company generates for each horsepower (HP) unit of its equipment’s power capacity. It is computed as revenue from hydraulic fracturing or pressure pumping on an annual basis divided by active horsepower.
EBITDA Per Horsepower (Annualized)
EBITDA per horsepower measures the profitability and efficiency of a company’s operations relative to its horsepower (HP). This metric indicates the average EBITDA generated by each unit of horsepower in a company’s fleet of equipment. It is computed as EBITDA from hydraulic fracturing or pressure pumping on an annual basis divided by active horsepower.
Revenue Per Active Horsepower Per Month
Revenue per active horsepower per month (revenue per HHp per month) measures the efficiency and profitability of compression equipment. It is calculated by dividing the total revenue generated by a piece of equipment (such as a compression equipment) by the total active horsepower of that equipment, and then dividing that by the number of months in a given period.
Gross Profit Margin
Gross profit margin measures the percentage of revenue that exceeds the cost of goods sold (COGS)
Net Profit Margin
Net profit margin represents the percentage of revenue that remains as profit after deducting all expenses, including taxes and interest. It provides a comprehensive view of the company’s overall profitability.
EBITDA Margin
EBITDA margin measures a company’s profitability without considering the effects of financing and accounting decisions.
Return on Equity (ROE)
Return on equity (ROE) shows how much profit a company generates with the money shareholders have invested. It is a key metric for assessing management’s ability to create value for shareholders.
Download this guide as an ebook today:
Guide to Oil & Gas Equipment & Services Industry KPIs for Investment Professionals
This guide highlights the key performance indicators for the oil & gas equipment & services industry and where investors should look to find an investment edge, including:
- Oil & Gas Equipment & Services Industry Business Model & Diagram
- Key Oil & Gas Equipment & Services Industry Metrics PLUS Visible Alpha’s Standardized Industry Metrics
- Available Comp Tables
- Industry KPI Terms & Definitions

