Covid-19 Impact on Global Bank Asset Quality Trends

In this analysis, we looked at asset quality trends for publicly traded banks around the world and Covid-19 pandemic’s impact on the industry, providing an overview of recent performance and a deep dive into future expectations. We found that non-performing loans (NPLs) are on the rise, and banks are building reserves to support the rising NPLs. In addition, we found that there is a wide variation by region in trends in bank asset quality due to government and central bank responses to Covid-19.
Our Approach
Using Visible Alpha data, we have created an industry aggregate for key asset quality parameters like non-performing assets (NPAs), credit costs, loan loss reserves and computed industry-related ratios. Our industry aggregate is based on the “best fit” calendarization method and each value is converted into USD using a spot exchange rate. We also computed the aggregate values in revision dimension data to facilitate our study on how the Covid-19 pandemic has impacted analysts’ views on banking sector asset quality throughout 2020. For revision trends analysis, we have excluded companies on which coverage was initiated in 2020 because we do not have complete revision dimension data for those companies. We define Feb. 29, 2020, as pre-Covid and Sep. 30, 2020, as peak Covid level. Download the full analysis here.
NPLs on the Rise But Moratorium and Stimulus Delaying Peak To 2021
Banks generally classify a performing (standard) loan as a non-performing loan (NPL) when the borrower fails to pay the required installment 90 days past the due date. In a typical recessionary year like 2020, we would have expected a surge in bank NPLs – particularly in Q2-Q3 2020 – due to lockdown-led standstills in business activity, causing businesses and consumers to default on their loan installments.
However, many central banks announced moratorium relief schemes for both consumers and corporate borrowers to support and boost economic activity. Under these schemes, borrowers were allowed to defer installment payments for 3-6 months. This, in conjunction with other support programs such as loan restructurings, state-guaranteed loans and aggressive fiscal stimulus, has supported borrowers’ ability to pay or defer bank installments.
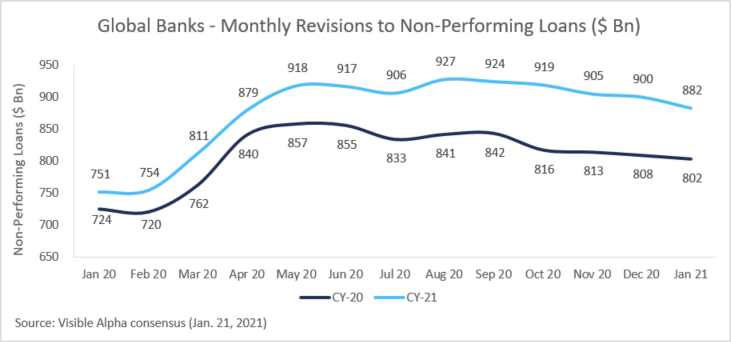
Although analysts have revised NPL forecasts for 2020, they expect these support programs to delay the NPL peak in 2021 before tapering off. We see this trend in both absolute NPL levels and NPL ratio, which is NPL as a percentage of gross loans.
Based on anticipation of a severe recession, initial analyst expectations were very aggressive, revising their NPL expectations to the peak of $857B for CY20 and $927B for CY21 from the pre-Covid level of $720B and $754B respectively (an increase of 19% and 23%, respectively). However, as authorities opened the economy with stimulus packages, analysts are now expecting $802B and $882B NPLs in CY20 and CY21 respectively, a 6.4% and 4.9% decline from recent peaks.
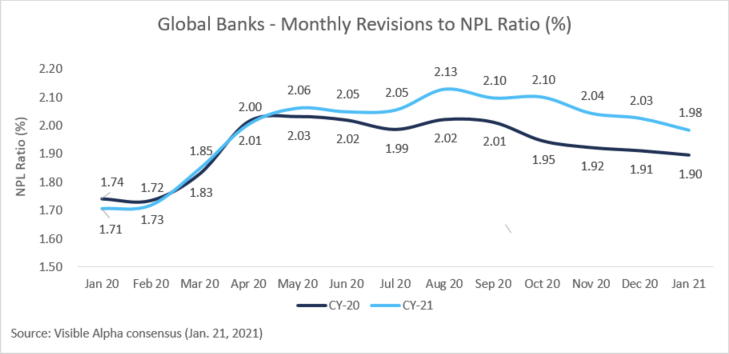
Similarly, the NPL ratio is also expected to be at 1.90% and 1.98% in CY20 and CY21, respectively, from pre-Covid levels of 1.73% and 1.72%.
Banks Build Reserves to Support Rising NPLs
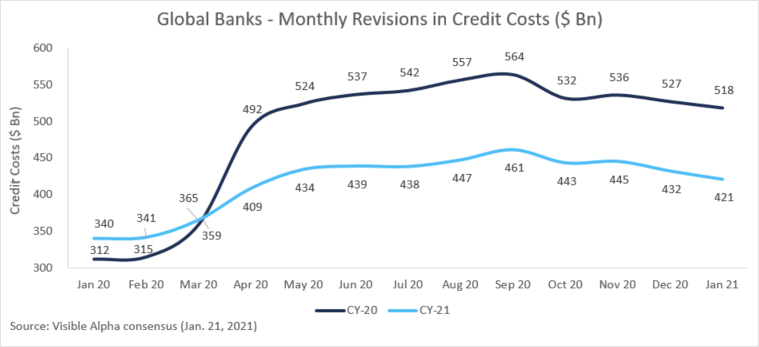
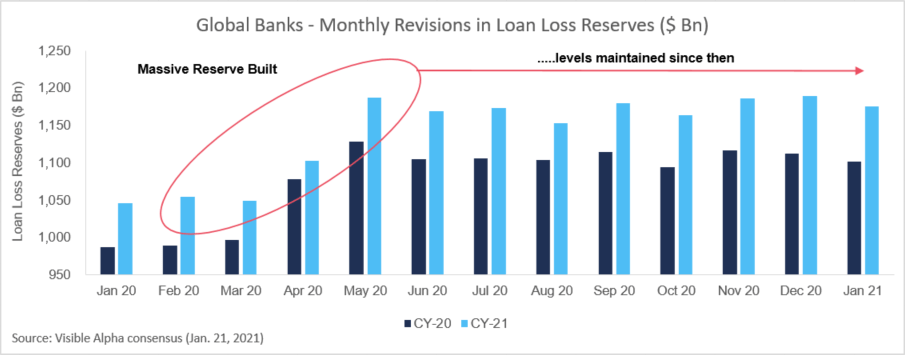
In anticipation of higher NPLs, global banks built massive loan loss reserves (also known as Allowance for Loan Losses) in H1 CY20 by charging provisions (credit cost/impairments) to P&L accounts. This caused a sharp decline in estimates of near-term earnings.
These provisions for loan losses flow into the bank’s loan loss reserve account, which is a contra asset in the balance sheet. Analysts are now expecting $1.1 trillion and $1.2 trillion loan loss reserves for CY20 and CY21 respectively, an increase of approximately 11% from pre-Covid levels.
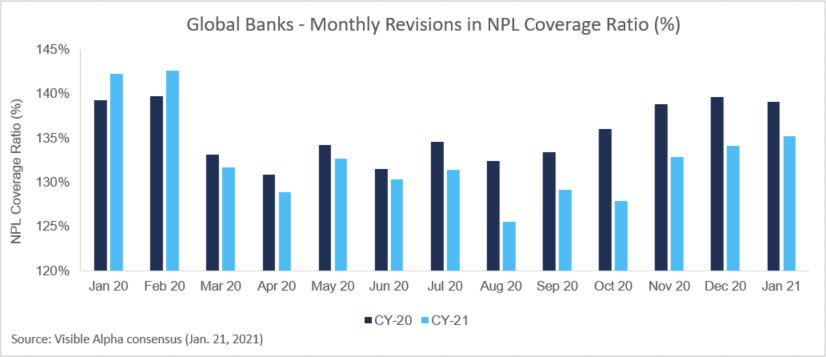
A closer look at the NPL coverage ratio, which indicates how much loan loss reserves banks have created for every dollar of NPLs, suggests that analysts are not expecting the current reserves to be significantly higher compared to pre-Covid levels. The current consensus estimate of this ratio is 139% and 135% for CY20 and CY21 respectively, similar to pre-Covid levels. This indicates that although at the global level banks have been building reserves to support rising NPLs they aren’t creating enough additional reserve buffers to meet contingencies.
To read more about the diverse regional variations in NPL trends and a global breakdown of market expectations for earnings in CY20 and CY21, download the full analysis here. 
For more information on the key performance indicators in the commercial banking industry, read our industry KPI guide.
This content was created using Visible Alpha Insights.
Visible Alpha Insights is an investment research technology platform that provides instant access to deep forecast data and unique analytics on thousands of companies across the globe. This granular consensus data is easily incorporated into the workflows of investment professionals, investor relations teams and the media to quickly understand the sell-side view on a company at a level of granularity, timeliness and interactivity that has never before been possible.


