We’ve noticed an interesting divergence between recent Facebook (FB) performance and consensus estimates. Over the last 3 months, Facebook has been flat vs. the S&P 500 gain of 7% and a NASDAQ gain of 8%. Facebook now sits at one of its lowest valuations in its trading history.
Source: Google Finance as of February 27, 2018
Is Facebook’s business model at fault?
Increased concerns around Facebook’s business model may be behind the stock underperformance. The public and the government are increasingly scrutinizing social media companies and the ways in which they have been manipulated for malicious intent. Within this environment, there have been three reactions that increase the risk around Facebook’s future revenue and profitability trajectory:
- Potential government regulatory actions (i.e. Europe’s General Data Protection Regulation)
- Facebook tweaks to their newsfeed algorithm, which could lower user engagement and user growth
- Increased costs to monitor content on their platform
Advertising revenue estimates
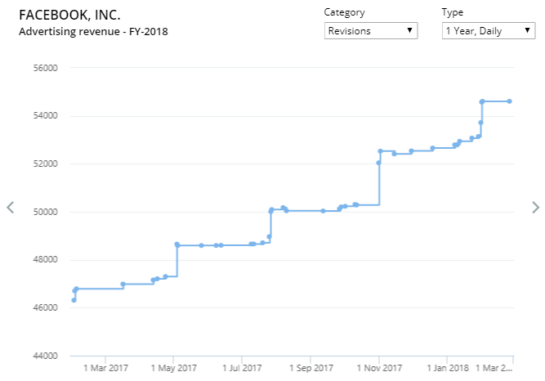
Despite these concerns and the stock movement, sell-side analysts have continued to move up their 2018 advertising revenue estimates, with estimates now sitting at $55 billion vs. $53 billion 3 months ago.
Source: Visible Alpha as of February 26, 2018
Revised GAAP Expenses
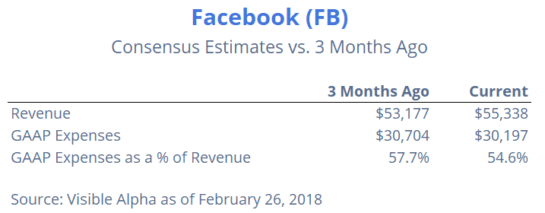
Expenses similarly have been revised down, despite investor concerns of increased expenses to monitor content. Over the last three months, analysts have revised down their GAAP expense estimates as a percentage of overall revenue from 57.7% to 54.6%.

We’ll get the first signs of evidence on which side is right as we approach FB’s 1Q18 results, which should come in May.


