Total operating expenses include all expenses incurred by brewers, distillers and vintners, and soft drink companies through their normal business operations. This includes rent, equipment, inventory costs, marketing, and payroll, among others.
Key performance indicators (KPIs) are the most important business metrics for a particular industry. When understanding market expectations for the beverage industry, whether at a company or industry level, some industry KPIs to consider are:
Overall Beverages
Brewers
Distillers and Vintners
Soft Drinks / Non-alcoholic Beverages
* Company level consolidated volume and average selling prices
Visible Alpha’s Standardized Industry Metrics
To understand market expectations for the beverage industry, a key information source is sell-side analyst estimates and consensus forecast data. The buy-side, sell-side, and public companies leverage this type of data to conduct competitive analysis, a type of analysis conducted by professional analysts that involves comparing standardized metrics of one company with those of similar companies. Because companies report metrics differently – and sometimes on different metrics altogether – standardizing the key metrics for each company can be a cumbersome process.
Visible Alpha Insights includes analyst data, company data, and industry data at a level of granularity unparalleled in the market. Our industry data – Standardized Industry Metrics – enables market participants to quantify and compare market expectations for companies across 150+ industries.
Data as of February 2023
Industry KPI Terms & Definitions
Visible Alpha offers an innovative, integrated experience through real-time, granular consensus estimates and historical data created directly from the world’s leading equity analysts. Using a subset of the below KPIs, this data can help investors hone in on the key drivers of companies to uncover investment opportunities.
Sales Volume
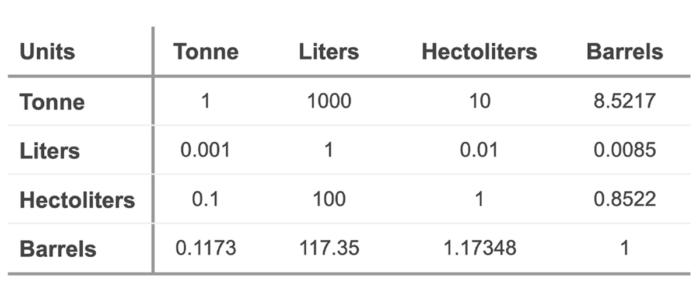
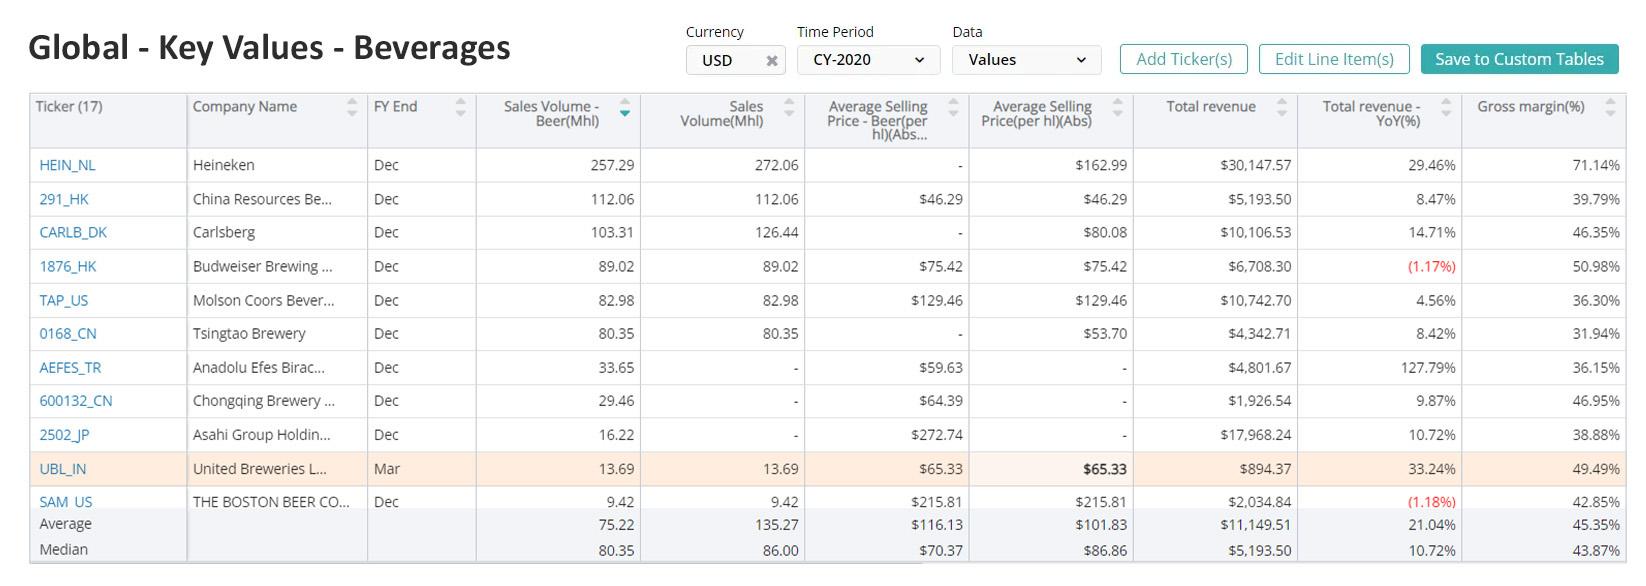
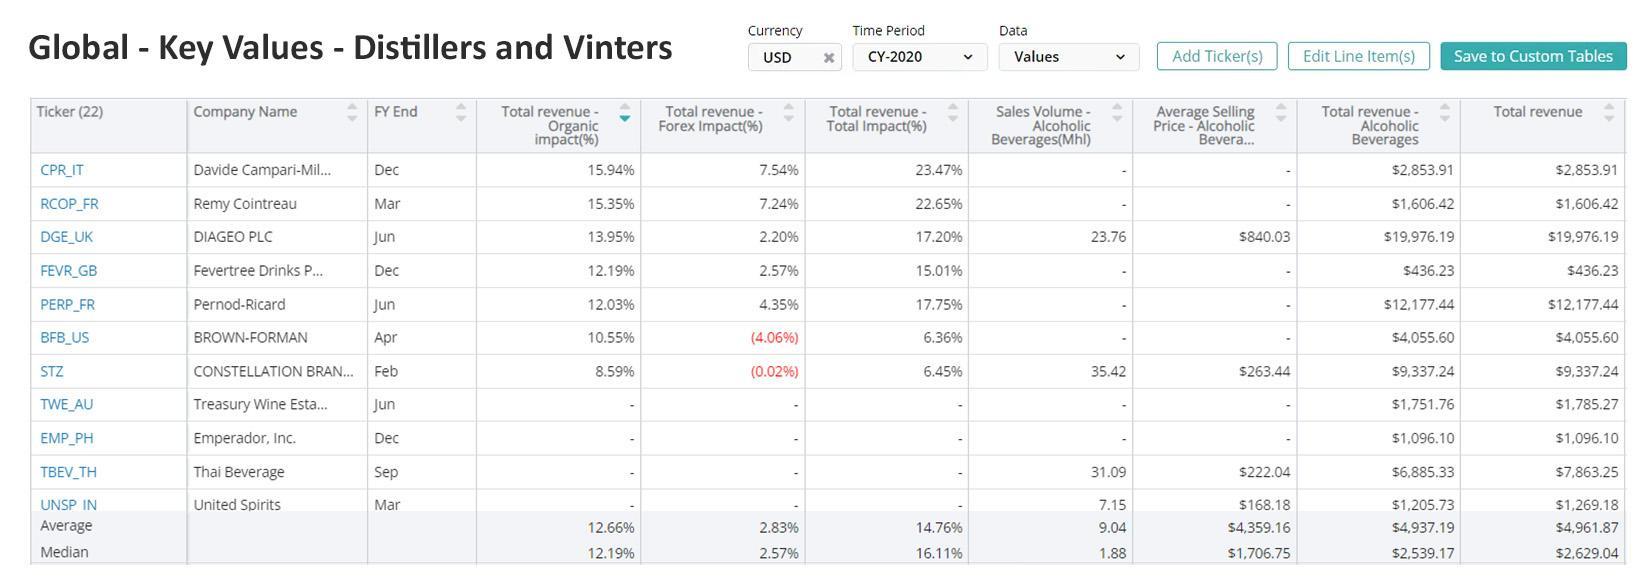
Sales volume / shipment is the recorded quantity of products delivered to customers during a given period. Volume sold can be measured in metric tons, barrels, liters, hectoliters, or total cases delivered.
On the Visible Alpha Insights platform, we offer a further breakdown of sales volume by product type: Sales Volume – Beer, Sales Volume – Liquor & Spirits, Sales Volume – Alcoholic Beverages, Sales Volume – Milk, Sales Volume – Tea/Coffee, and Sales Volume – Non-Alcoholic Beverages.
Average Selling Price (ASP)
Average selling price (ASP) is the price per unit of alcoholic beverages sold, generally represented in the form of ASP per hectoliter (hl), ASP per barrel, or ASP per case.
On the Visible Alpha Insights platform, we offer a further breakdown of ASP by product type: Average Selling Price – Beer, Average Selling Price – Liquor & Spirits, Average Selling Price – Alcoholic Beverages, Average Selling Price – Milk, Average Selling Price – Tea/Coffee, and Average Selling Price – Non-Alcoholic Beverages.
Gross Profit/(Loss)
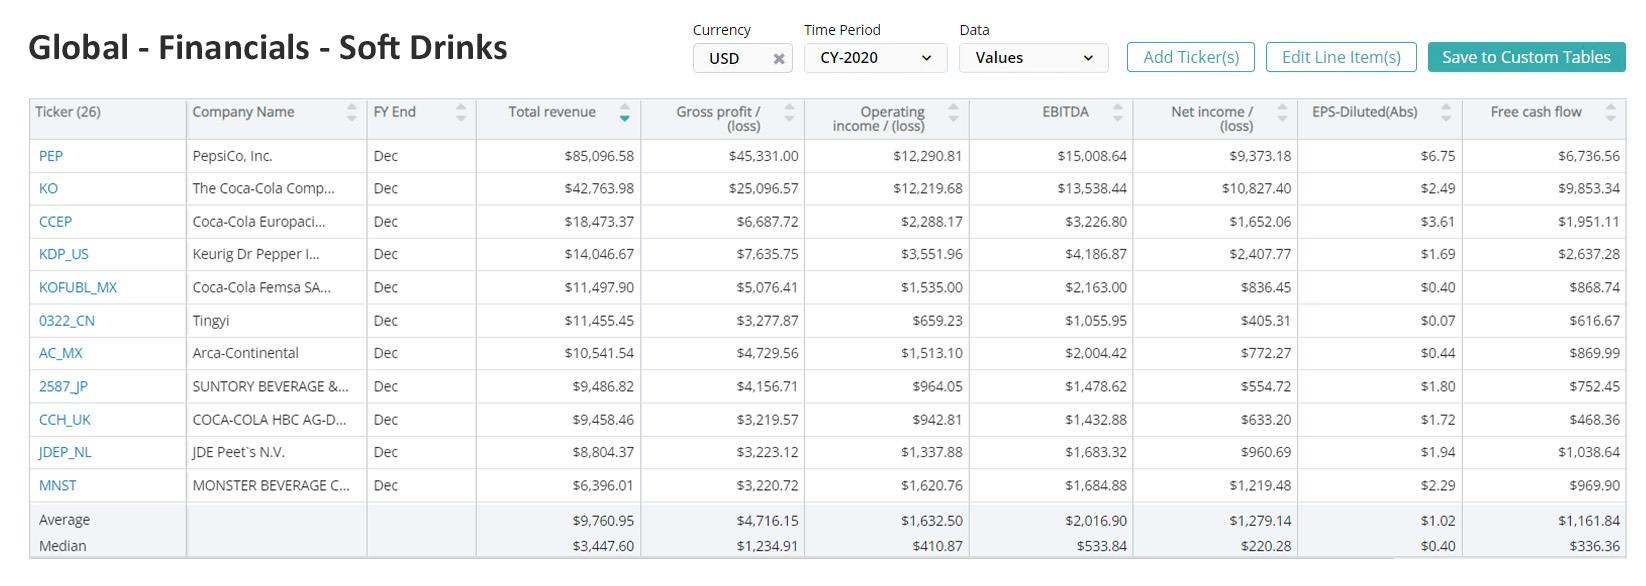
Gross profit/(loss) is the difference between the cost of goods sold and the revenue earned.
Operating Income/(Loss)
Operating income/(loss) is the amount of income or loss generated from the operations of a company, after deducting operating expenses such as compensation, distribution cost, and other general and administrative expenses.
On the Visible Alpha Insights platform, we offer a further breakdown of operating income/(loss) including Operating Income/(Loss) – Non-Alcoholic Beverages, Operating Income/(Loss) – Organic Impact, and Operating Income/(Loss) – Forex Impact.
Total Operating Expense
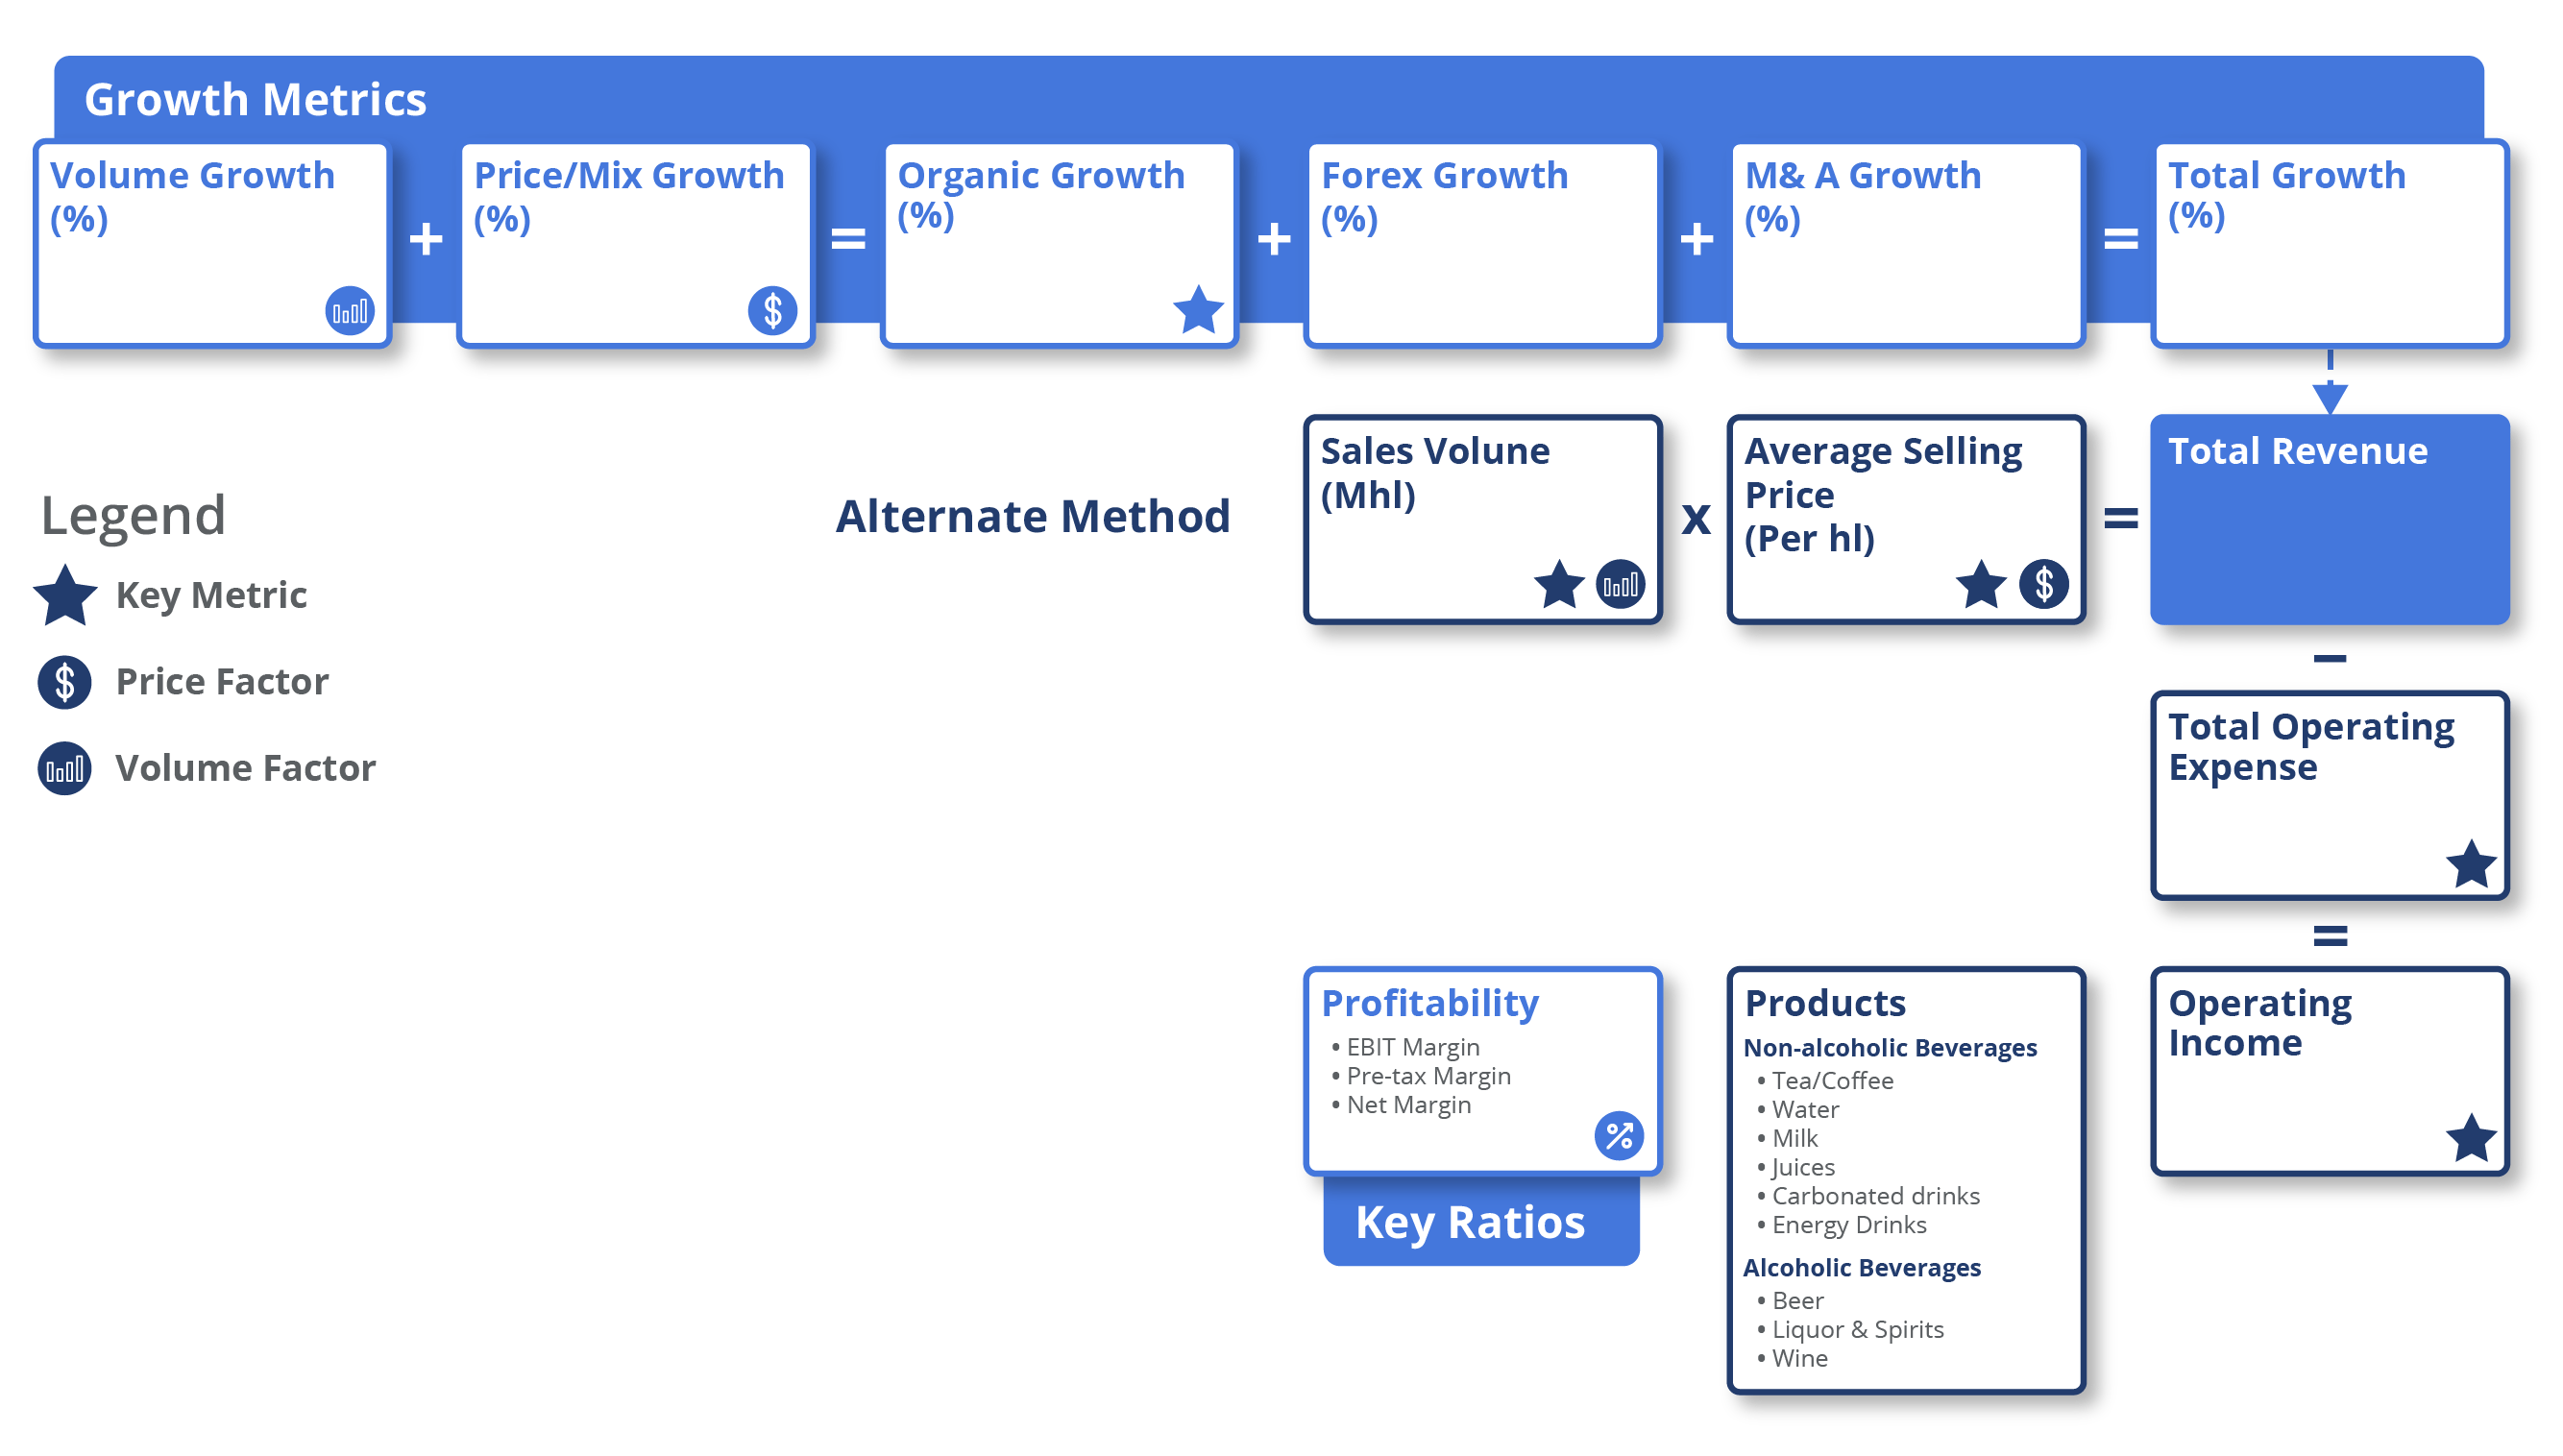
Total operating expenses include all expenses incurred by brewers, distillers and vintners, and soft drink companies through their normal business operations. This includes rent, equipment, inventory costs, marketing, and payroll, among others.
EBITDA
EBITDA or earnings before interest, taxes, depreciation, and amortization is a widely used measure of profitability.
Total Revenue – Volume Impact (%)
Total revenue volume impact refers to the revenue growth generated by the number of products sold.
Total Revenue – Price Impact (%)
Total revenue price impact refers to the revenue growth generated by the rise in the price of the products.
Total Revenue – Organic Impact (%)
Total revenue organic impact refers to the revenue growth generated from increasing output and enhancing sales internally. This does not include growth attributable to mergers and acquisitions, currency fluctuations, etc. It is generally calculated as the summation of volume growth and price growth.
Total Revenue Forex Impact (%)
Total revenue forex impact refers to the effect of changes in exchange rates on revenue earned in foreign currencies. A stronger domestic currency will translate into lower foreign revenue when converted to domestic currency.
Total Revenue – Acquisition/Divestiture Growth (%)
Acquisition/divestiture growth isolates the growth in revenue that can be attributable to acquisitions or divestitures.
Total Revenue – Total Impact (%)
Total revenue total impact refers to revenue growth as compared to the base year in percentage.
Download this guide as an ebook today:
Guide to Beverages KPIs for Investment Professionals
This guide highlights the key performance indicators for beverages and where investors should look to find an investment edge, including:
- Beverages Business Model & Diagram
- Key Beverages Metrics PLUS Visible Alpha’s Standardized Industry Metrics
- Available Comp Tables
- Industry KPI Terms & Definitions

