Net debt / EBITDA is the ratio of net debt to EBITDA. It is a measure of the financial leverage of a company.
Key performance indicators (KPIs) are the most important business metrics for a particular industry. To gauge market expectations for the movies and entertainment industry, whether at a company or industry level, some industry KPIs to consider are:
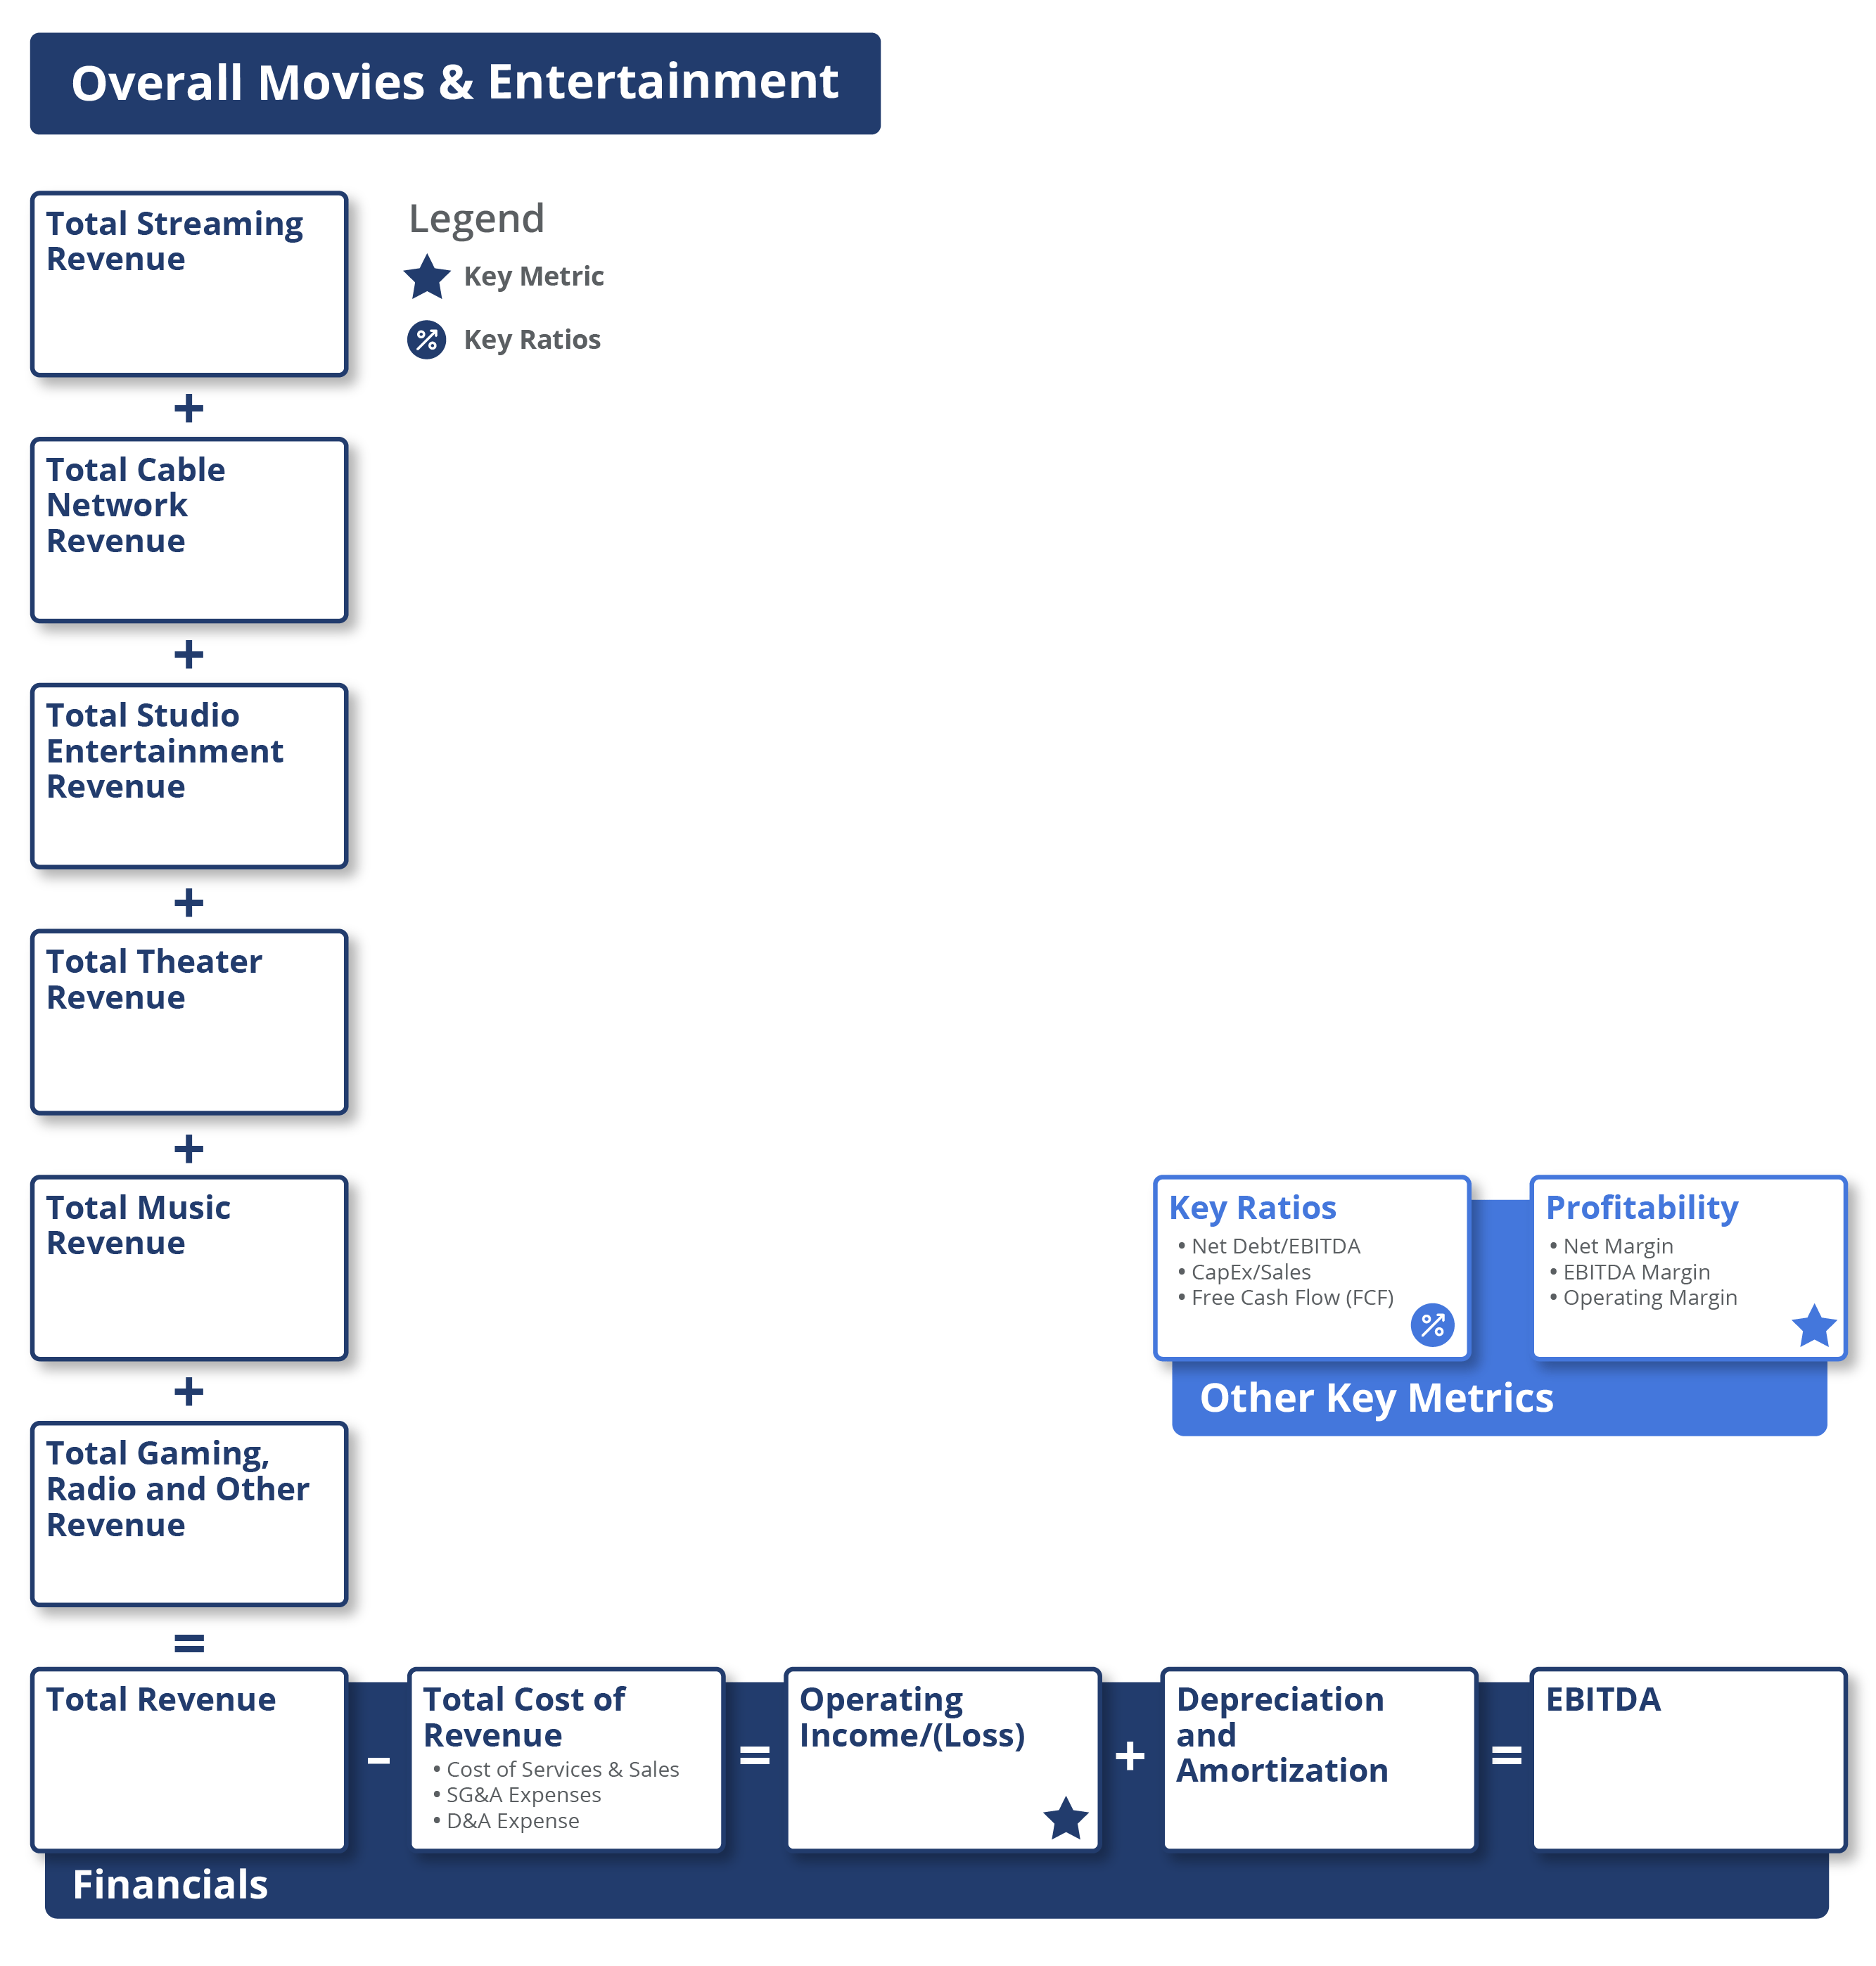
Overall Movies and Entertainment
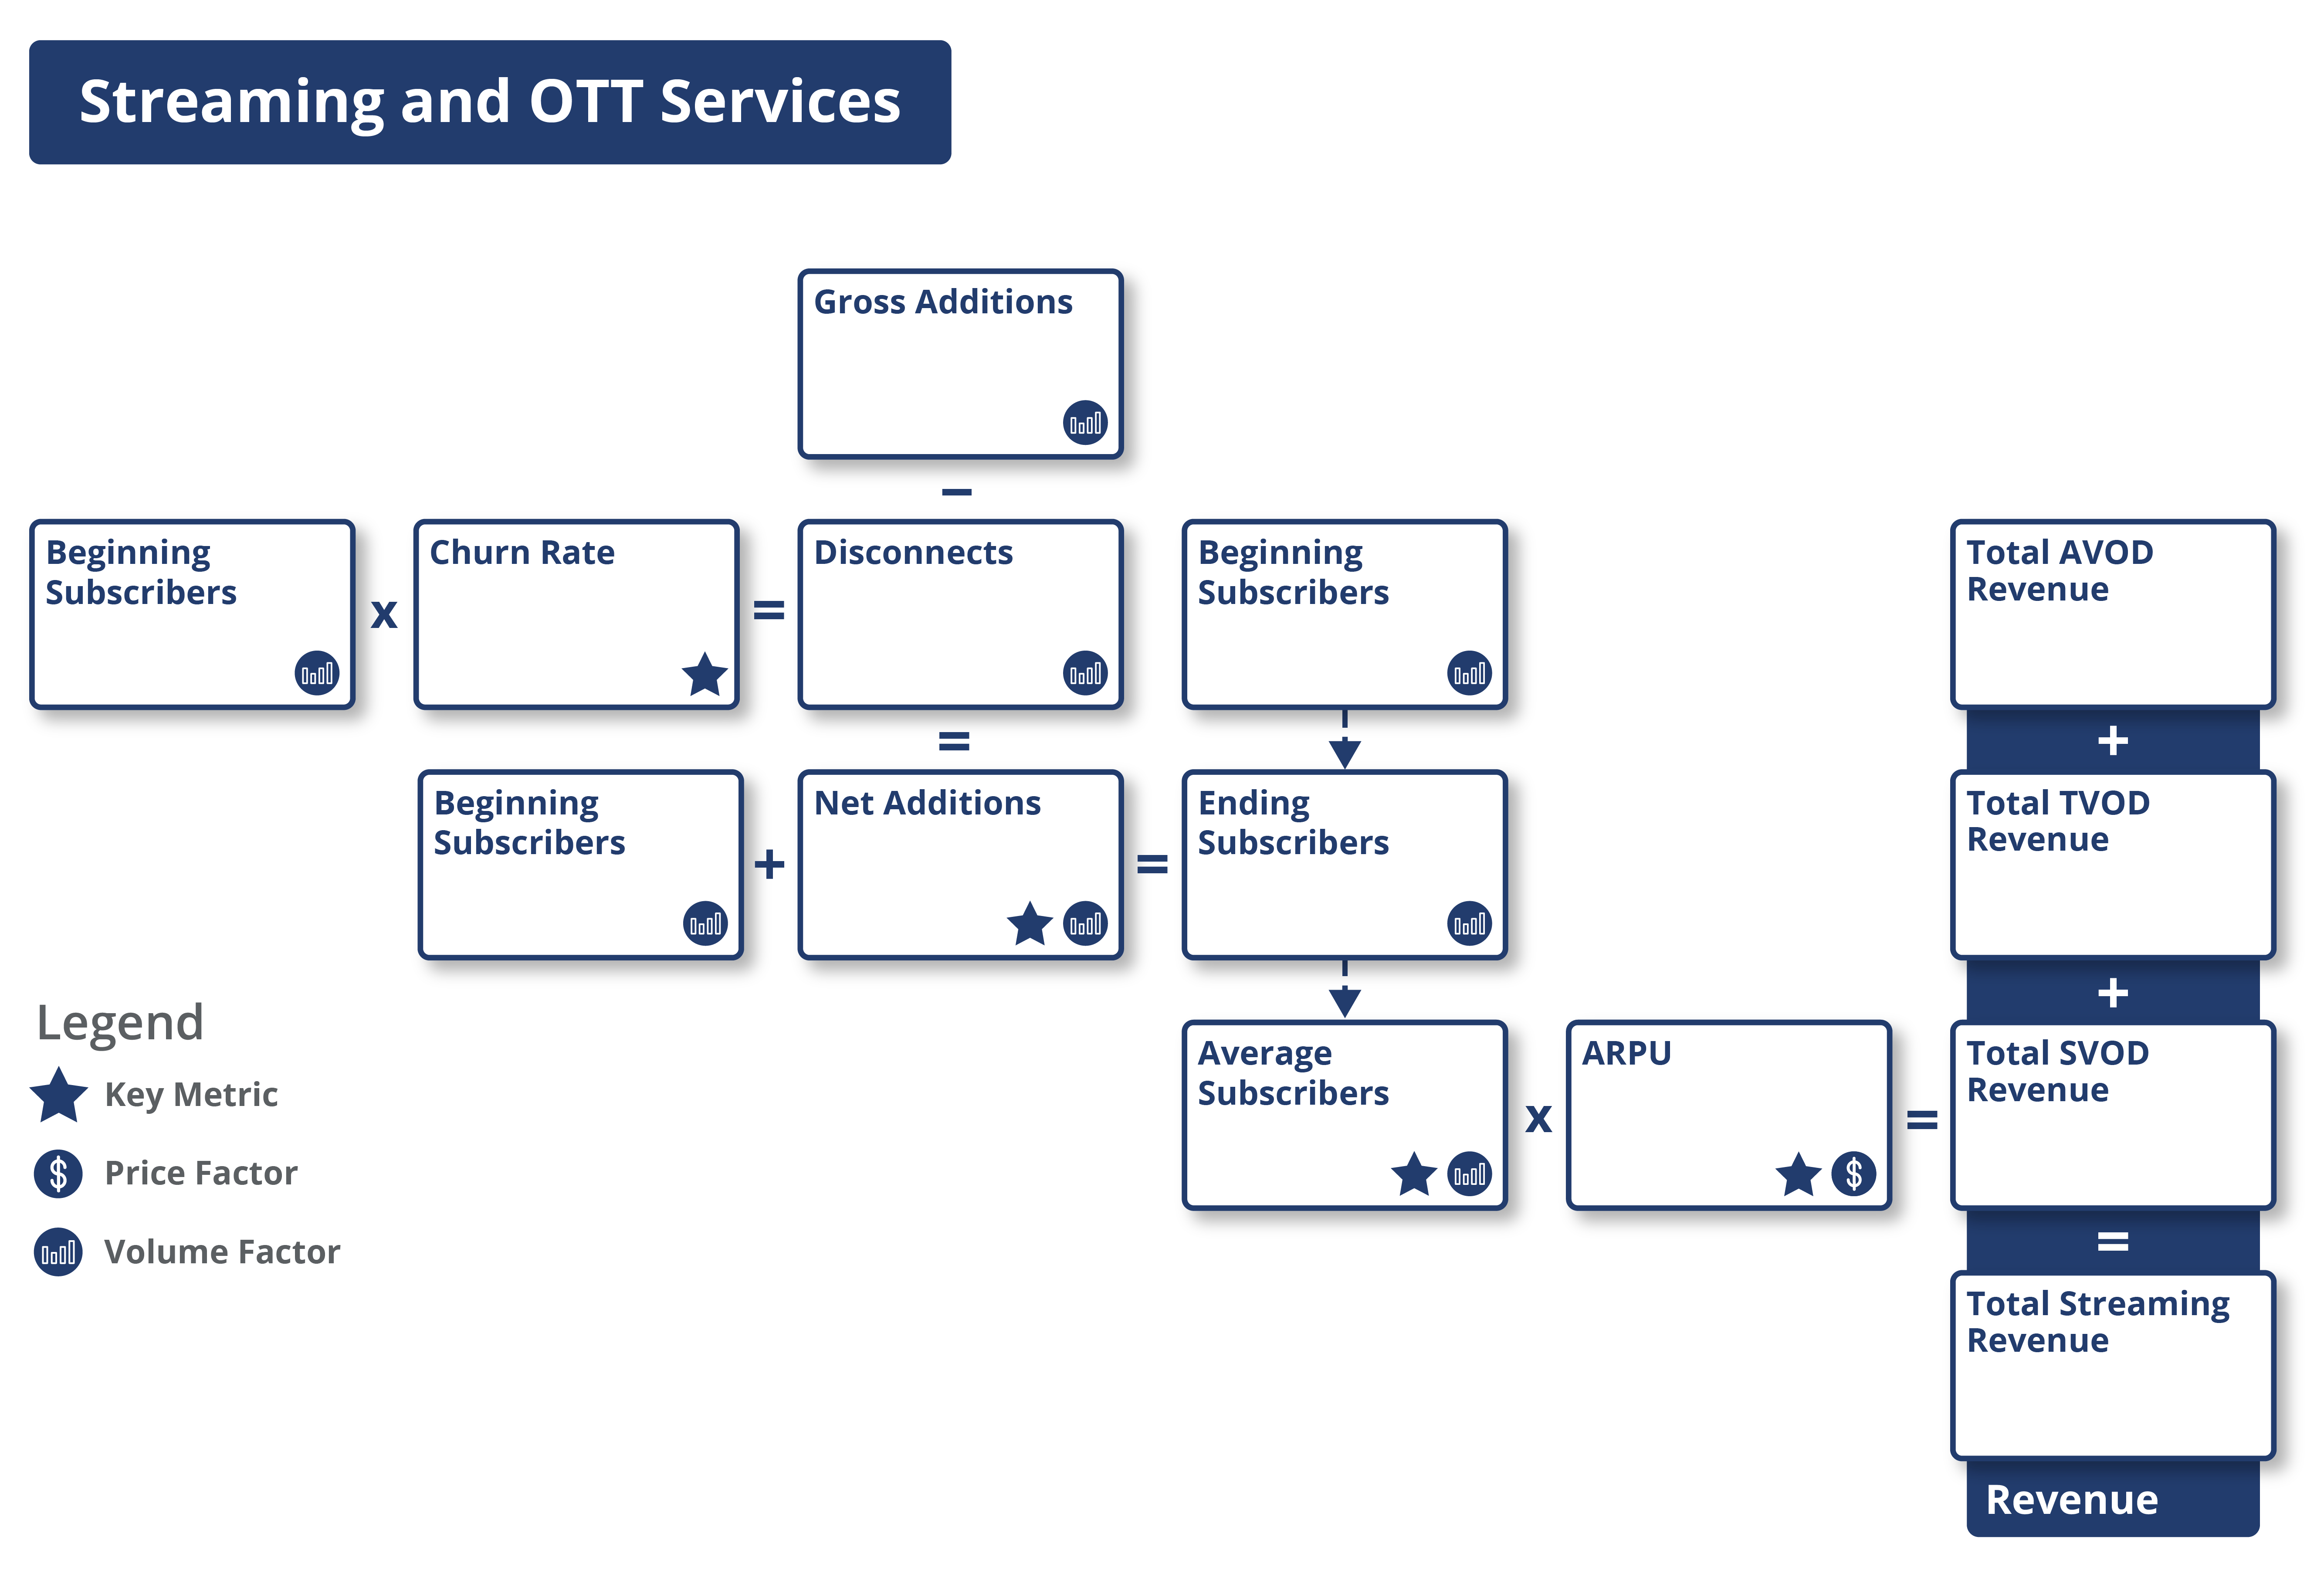
Streaming and OTT Services
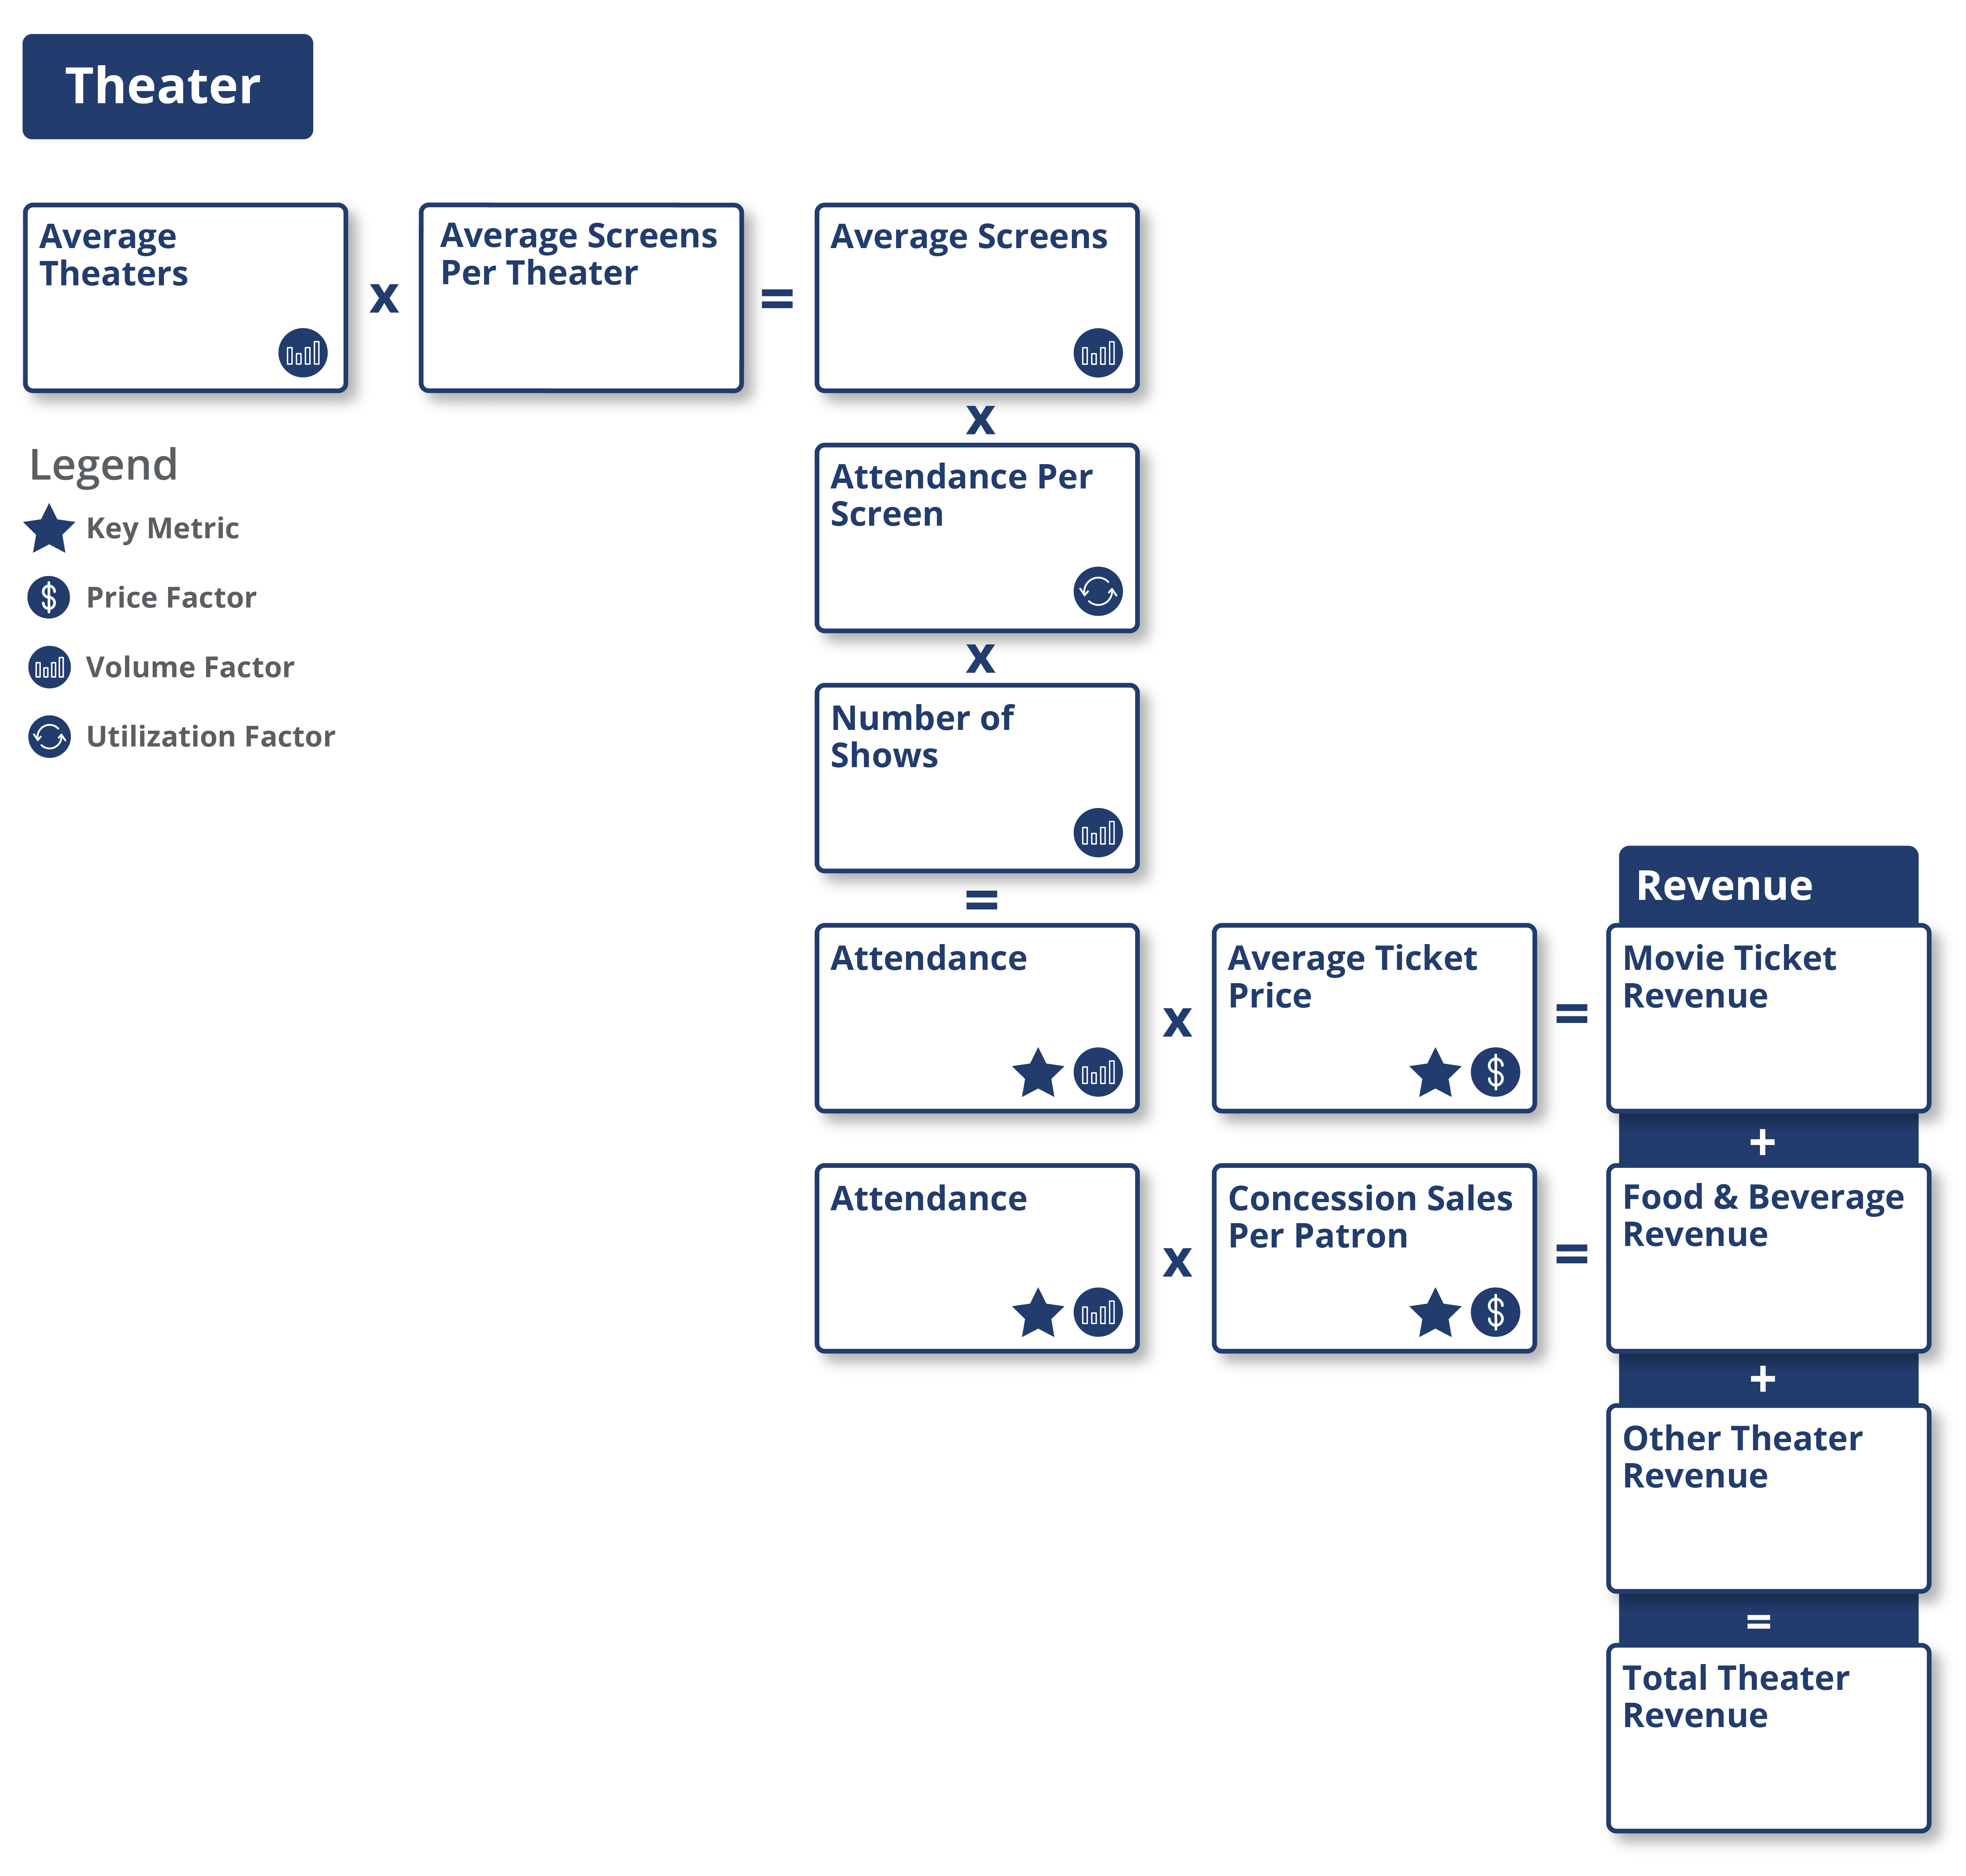
Theater
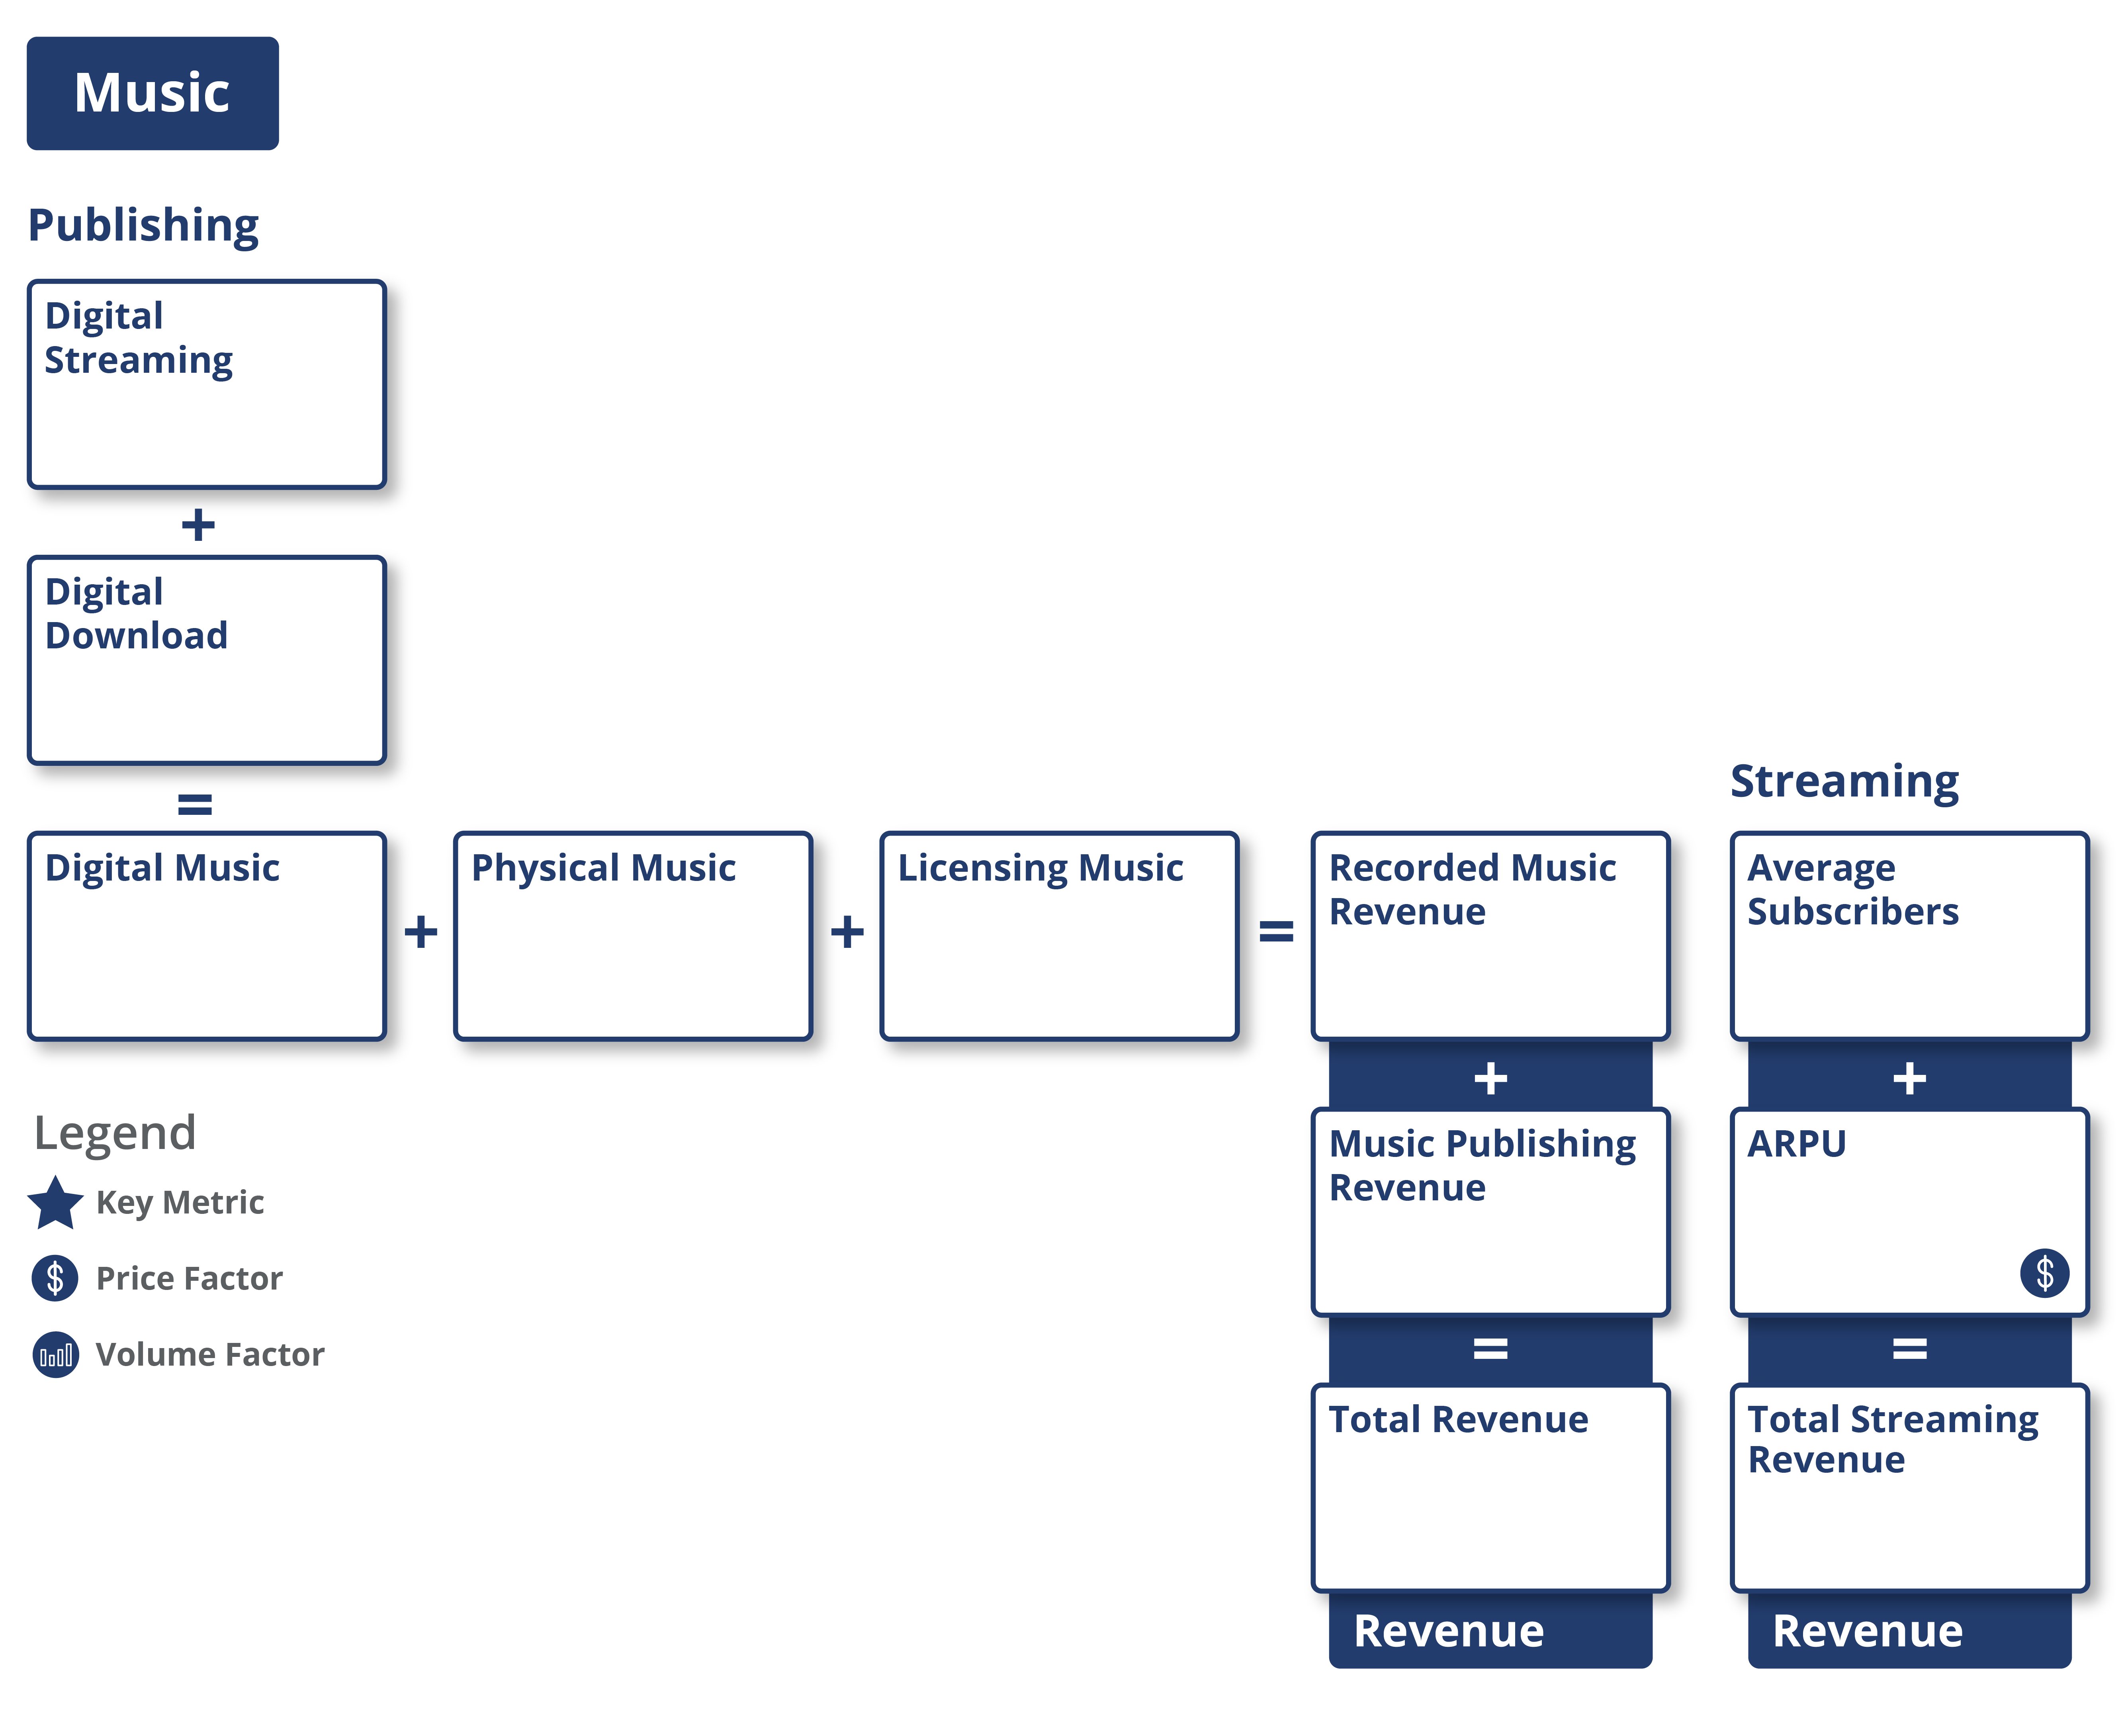
Music
Publishing
Streaming
Visible Alpha’s Standardized Industry Metrics
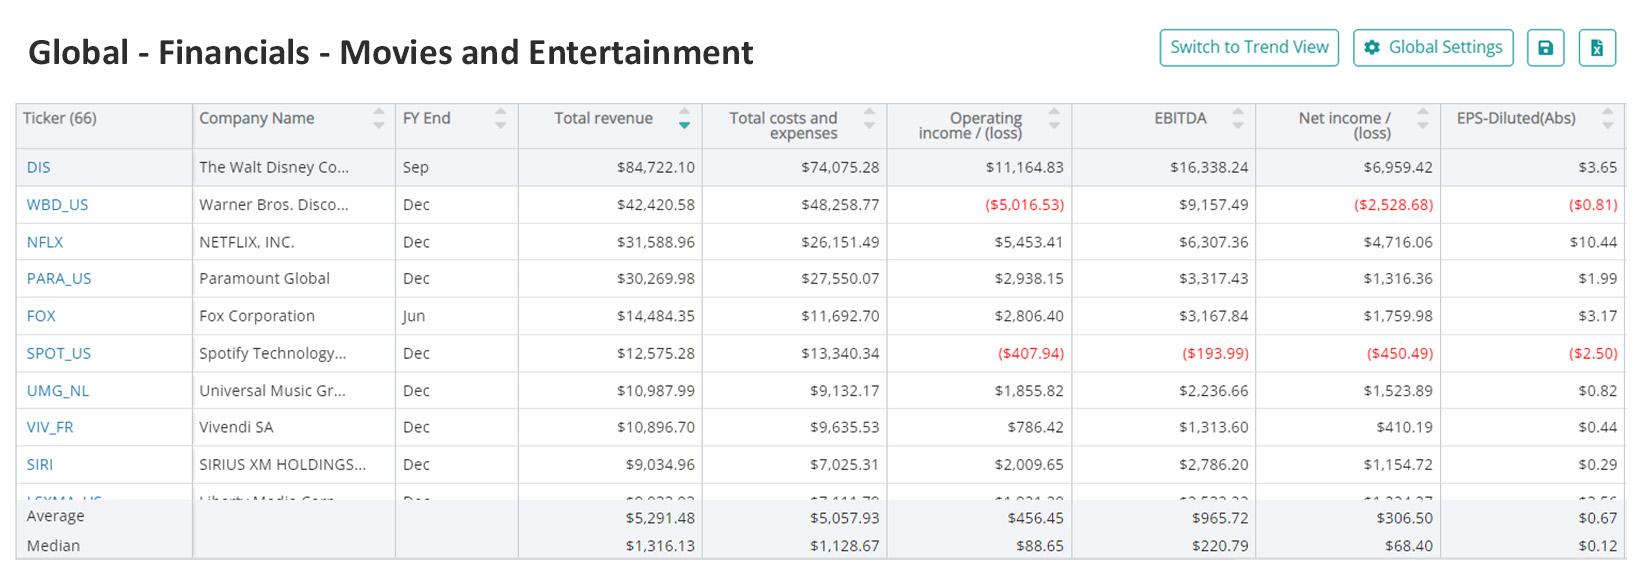
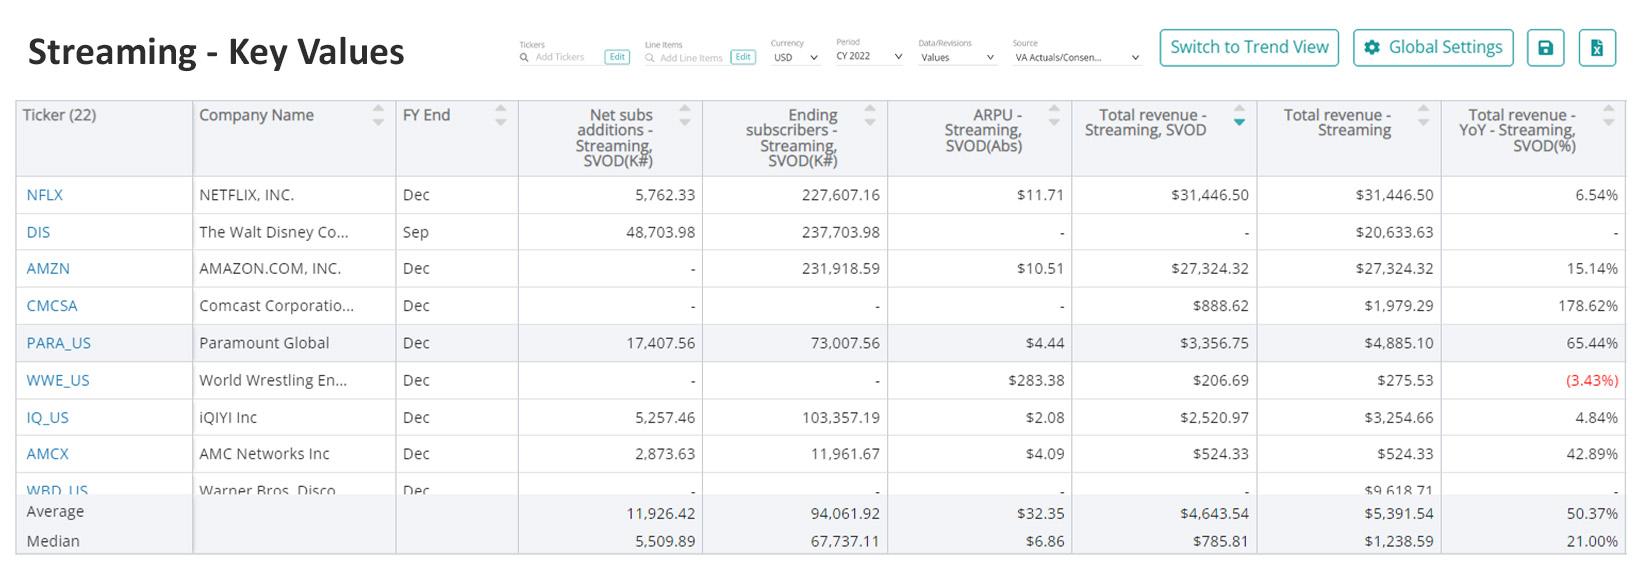
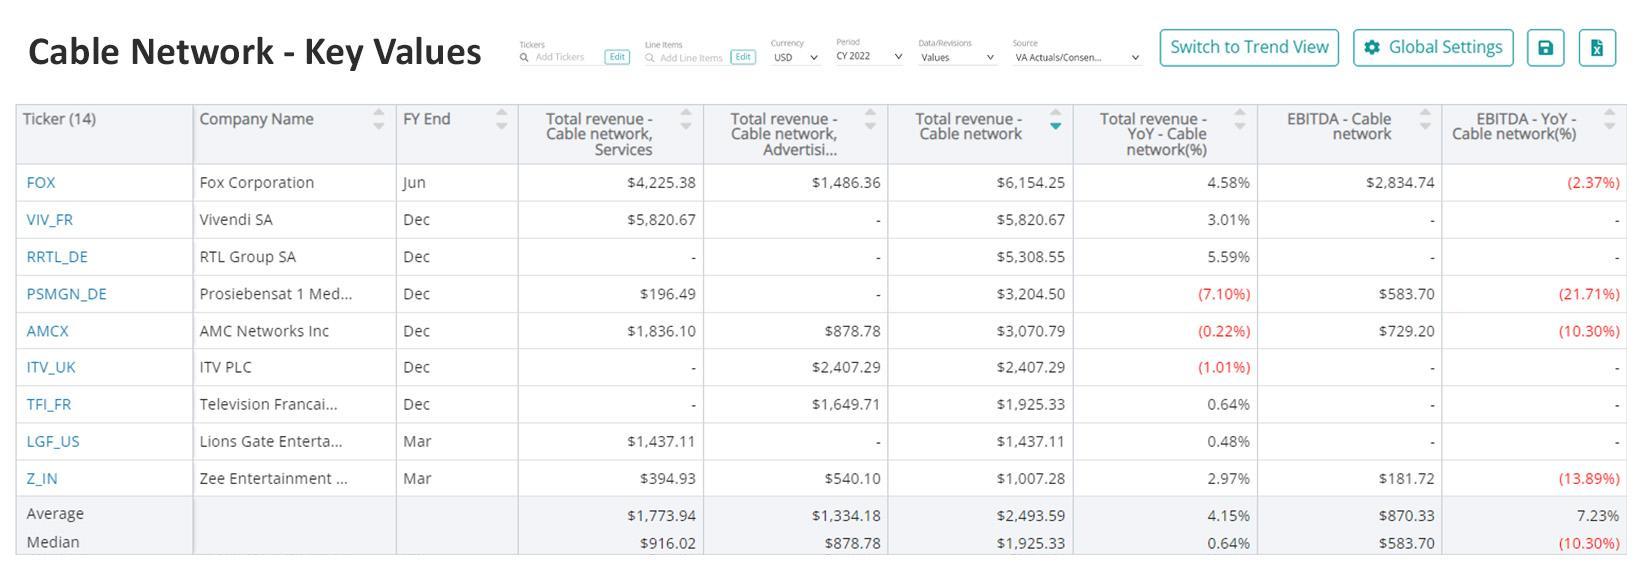
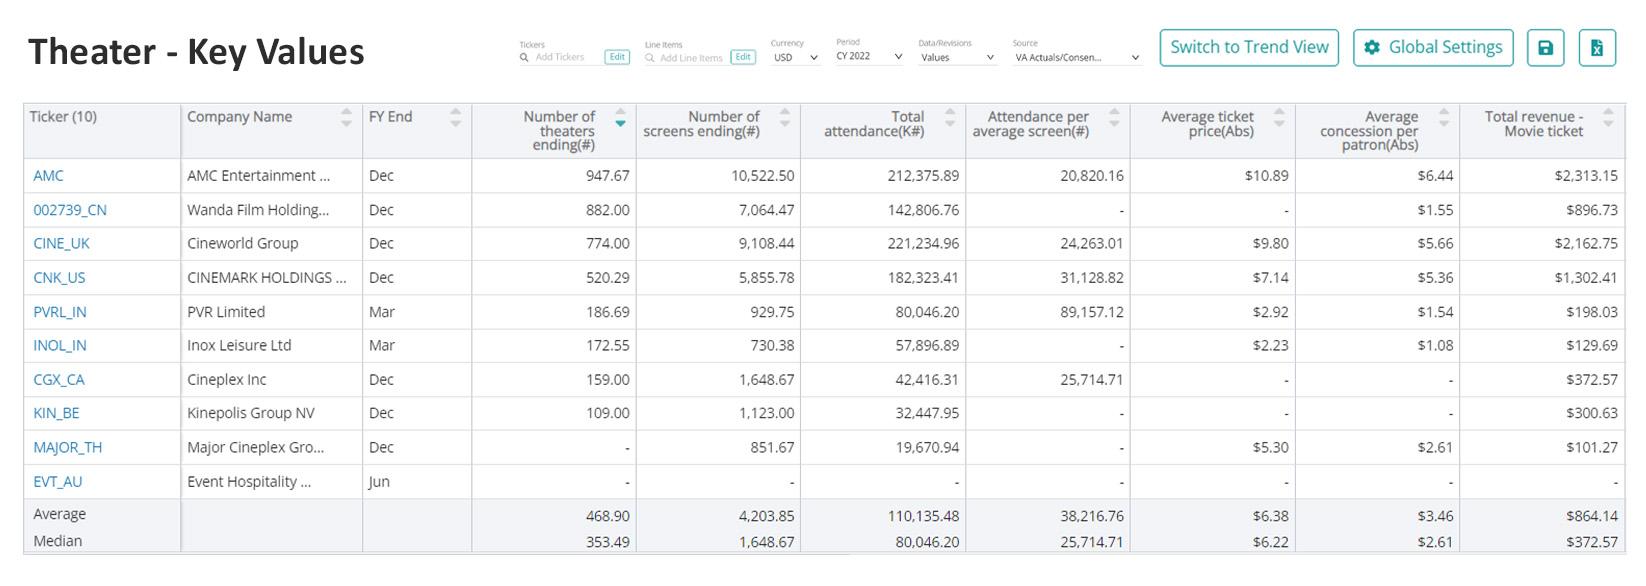
To understand market expectations for the movies and entertainment industry, a key information source is sell-side analyst estimates and consensus forecast data. The buy-side, sell-side, and public companies leverage this type of data to conduct competitive analysis, a type of analysis conducted by professional analysts that involves comparing standardized metrics of one company with those of similar companies. Because companies report metrics differently – and sometimes report on different metrics altogether – standardizing the key metrics for each company can be a cumbersome process.
Visible Alpha Insights includes analyst data, company data, and industry data at a level of granularity unparalleled in the market. Our industry data – Standardized Industry Metrics – enables market participants to quantify and compare market expectations for companies across 150+ industries.
Data as of January 2023
Industry KPI Terms & Definitions
Visible Alpha offers an innovative, integrated experience through real-time, granular consensus estimates and historical data created directly from the world’s leading equity analysts. Using a subset of the below KPIs, this data can help investors hone in on the key drivers of companies to uncover investment opportunities.
Overall Movies and Entertainment
Net Debt / EBITDA
Net debt / EBITDA is the ratio of net debt to EBITDA. It is a measure of the financial leverage of a company.
Capex / Sales
Capex to sales measures the amount of capital expenditures incurred as a percentage of sales (revenue).
Free Cash Flow (FCF)
Free cash flow (FCF) is the cash a company generates after considering cash outflows.
Net Margin
Net margin is net income/(loss) divided by total revenue.
EBITDA Margin
EBITDA (earnings before interest, tax, depreciation, and amortization) margin measures a company’s operating profit (before depreciation) as a percentage of revenue.
Operating Margin
Operating profit per one dollar of revenue. Calculated as operating profit divided by total revenue.
Streaming and OTT Services
Gross Addition
Gross addition is the total number of new subscribers added by a company before the adjustments made for the cancellation of service. It portrays a true picture of the actual number of subscriber additions made by a company over a given period.
Disconnects
Disconnects are the number of subscribers who cancel or choose not to renew or extend their subscription over a given period.
Churn Rate
Churn rate is the measurement of subscribers who choose not to renew their subscription or cancel it. It is measured in percentage and is calculated for a specific period (monthly, quarterly, or annually). Churn is calculated as the number of disconnected subscribers divided by the number of beginning subscribers for that period.
Net Addition
Net addition is the number of new subscribers that a company has after deducting the churn (disconnects) from the gross additions for a particular period.
Ending Subscribers
Ending subscribers are the number of subscribers a company has at the end of a given period. It is calculated by adding net additions to the existing subscribers a company has at the beginning of that period.
Average Subscribers
Average subscribers are the average number of subscribers a company has in a given period. It is computed by taking the average number of beginning and ending subscribers for that period.
Average Revenue Per User (ARPU)
ARPU, short for average revenue per user, is the revenue generated per unit or user by a company. ARPU is calculated as total revenue divided by the number of subscribers, users, or units. ARPU is a unit pricing factor and is measured monthly, quarterly, or annually.
Music Publishing
Recorded Music Revenue
Recorded music revenue is the revenue generated from the creation, recording, and distribution of songs and albums.
Music Publishing Revenue
Music publishing revenue is the revenue generated from the promotion and monetization of musical compositions. Music publishers ensure that songwriters receive royalties for their compositions, and also work to generate opportunities for those compositions to be performed and reproduced.
Music Streaming
Net Addition
Net addition is the number of new subscribers that a company has after deducting the churn (disconnects) from the gross additions for a particular period.
Monthly Active Users (MAU)
Monthly active users (MAU) refers to the number of unique subscribers of a company within a month.
Average Subscribers
Average subscribers are the average number of subscribers a company has in a given period. It is computed by taking the average number of beginning and ending subscribers for that period.
Average Revenue Per User (ARPU)
ARPU, short for average revenue per user, is the revenue generated per unit or user by a company. ARPU is calculated as total revenue divided by the number of subscribers, users, or units. ARPU is a unit pricing factor and is measured monthly, quarterly, or annually.
Theater
Number Of Theaters
Number of theaters is the actual count of theaters a company owns and operates in a particular region.
Number Of Screens
Number of screens is the total number of screens in a theater used for showcasing movies to paying audiences. These screens can be digital or non-digital.
Total Attendance
Total attendance is the total number of paying audiences that come to a movie theater in a given period.
Attendance Per Average Screen
Attendance per average screen is the total number of paying audiences per average screen in a theater.
Average Ticket Price
Average ticket price is the average price of a ticket that patrons pay at the cinema or theater in a given period.
Average Concession Per Patron
Average concession per patron is the average revenue received from the sale of food & beverage in a given period per paying customer.
Download this guide as an ebook today:
Guide to Movies and Entertainment KPIs for Investment Professionals
This guide highlights the key performance indicators for movies and entertainment and where investors should look to find an investment edge, including:
- Movies and Entertainment Business Model & Diagram
- Key Movies and Entertainment Metrics PLUS Visible Alpha’s Standardized Industry Metrics
- Available Comp Tables
- Industry KPI Terms & Definitions

