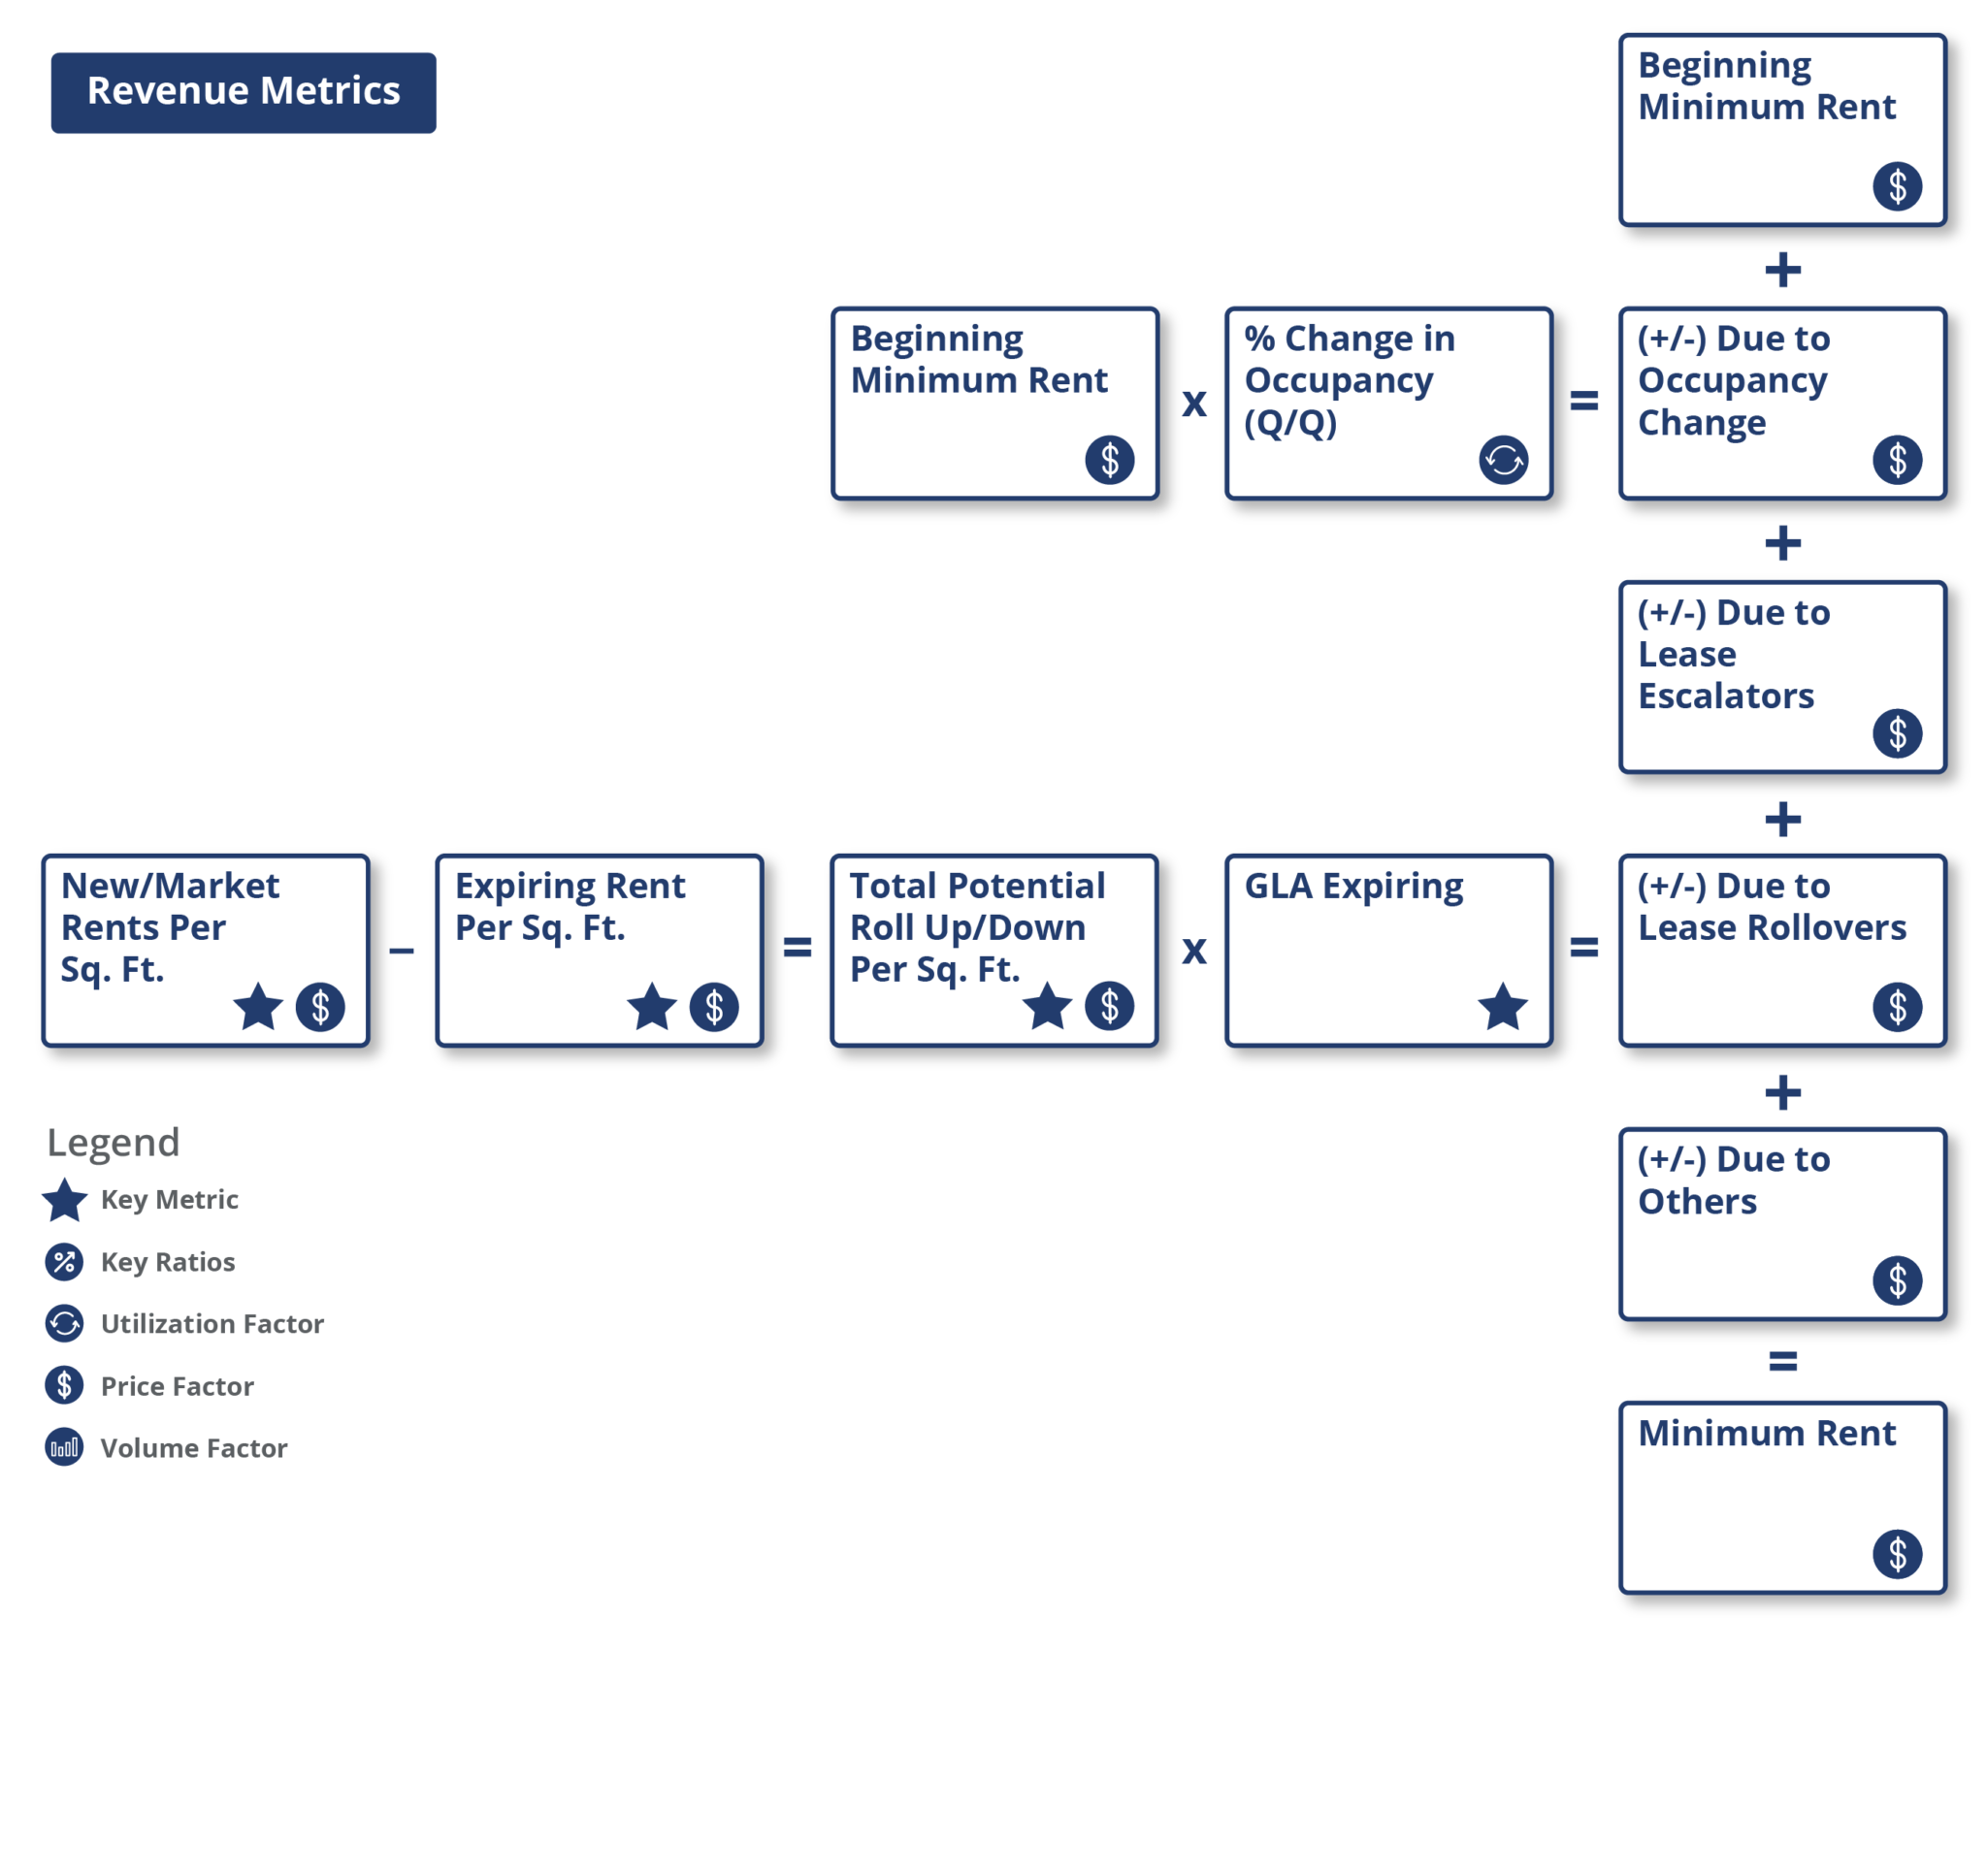
New rent per square foot is the rent per square foot at the time of the new lease.
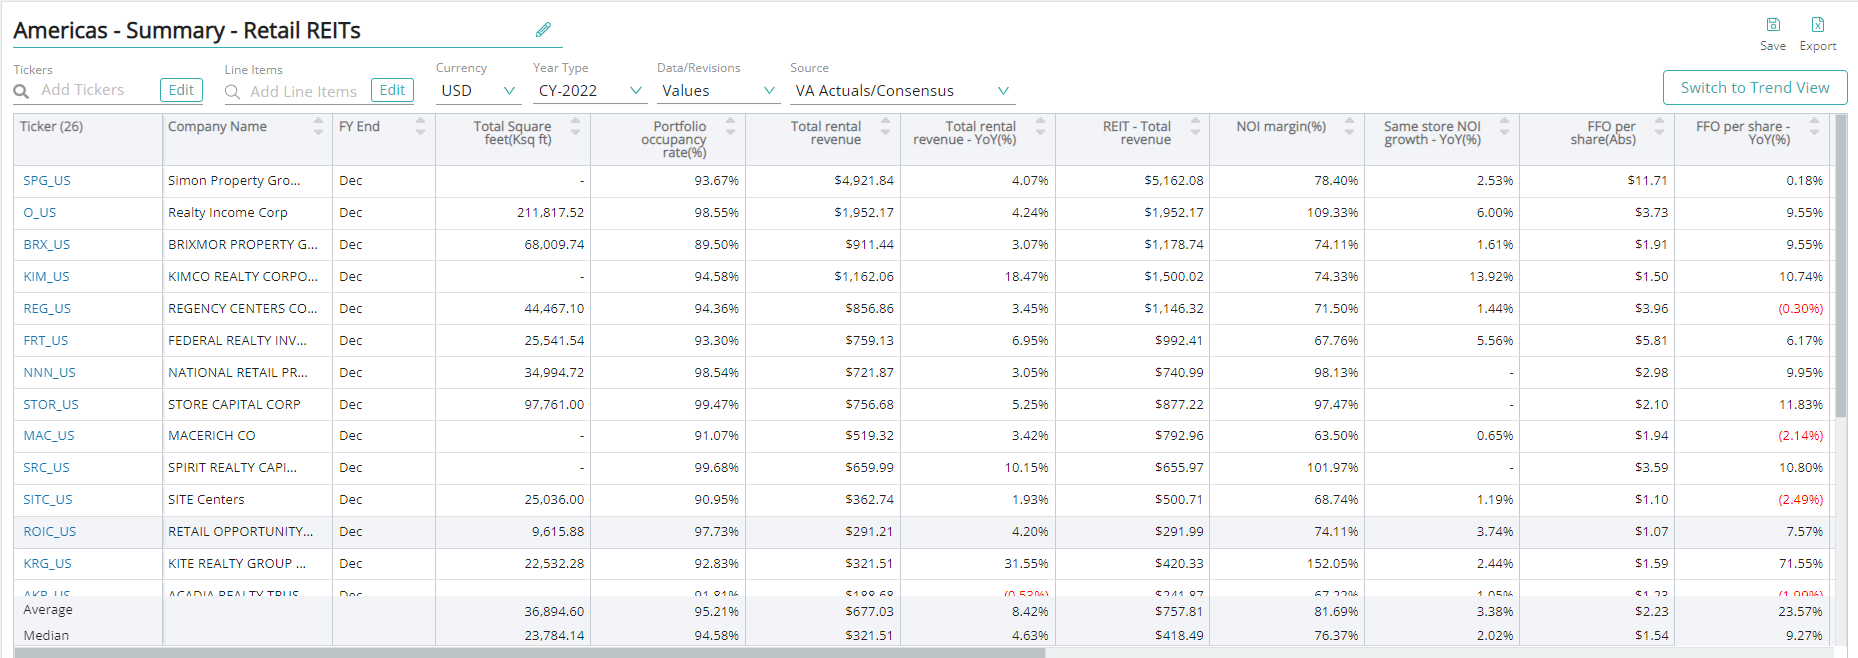
Key performance indicators (KPIs) are the most important business metrics for a particular industry. When understanding market expectations for Retail REITs, whether at a company or industry level, some Retail REITs KPIs to consider are:
Visible Alpha’s Standardized Industry Metrics
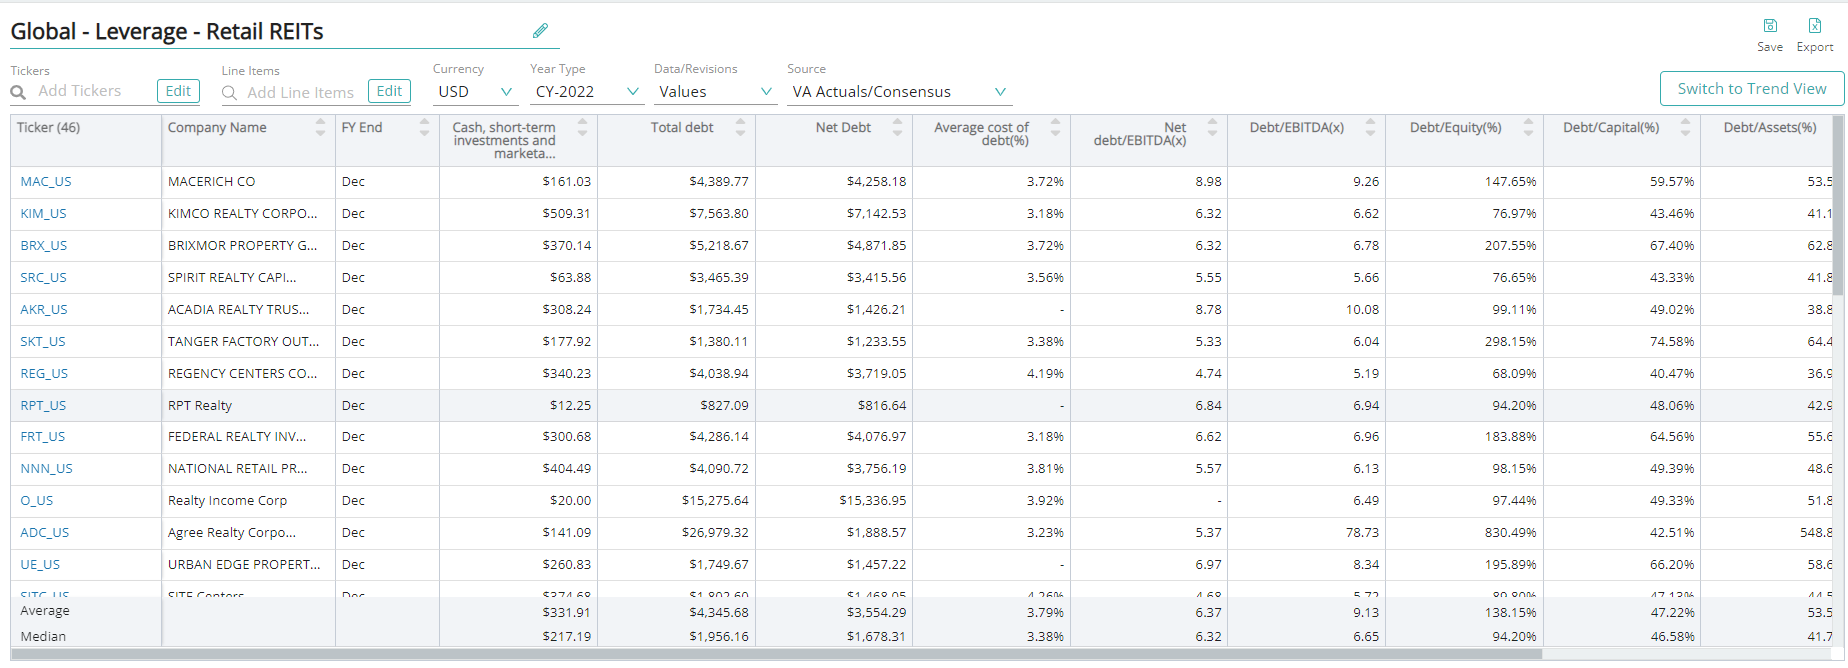
To understand market expectations for the retail REITs industry, a key information source is sell-side analyst estimate and consensus forecast data. The buy-side, sell-side, and public companies leverage this type of data to conduct competitive analysis, a type of analysis conducted by professional analysts that involves comparing standardized metrics of one company with those of similar companies. Because companies report metrics differently – and sometimes report on different metrics altogether – standardizing the key metrics for each company can be a cumbersome process.
Visible Alpha Insights includes analyst data, company data, and industry data at a level of granularity unparalleled in the market. Our industry data – Standardized Industry Metrics – enables market participants to quantify and compare market expectations for companies across 150+ industries.
Data as of January 2023
Industry KPI Terms & Definitions
Visible Alpha offers an innovative, integrated experience through real-time, granular consensus estimates and historical data created directly from the world’s leading equity analysts. Using a subset of the below KPIs, this data can help investors hone in on the key drivers of companies to uncover investment opportunities. Learn More >
Portfolio Occupancy Rate
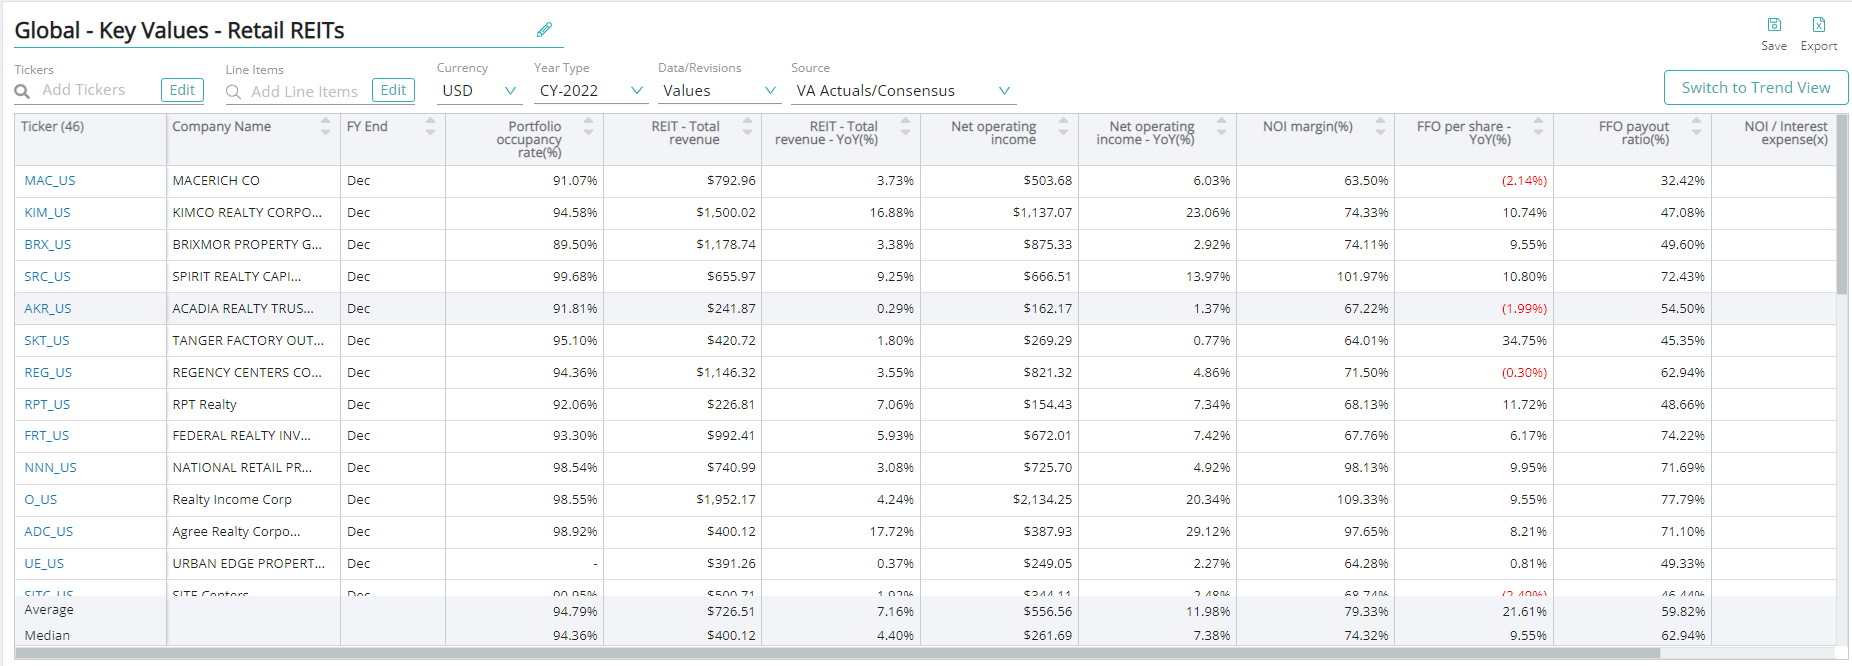
Portfolio occupancy rate measures the occupancy rate or the percentage area of a REIT’s property that has been leased. It is calculated as leased space divided by total leasable area. Portfolio occupancy rate is a measure of success that a REIT has had in attracting tenants and leasing the space it owns. The higher the occupancy rate for a REIT over time (compared to its peers), the better.
Same-store Net Operating Income (NIO) Growth (%)
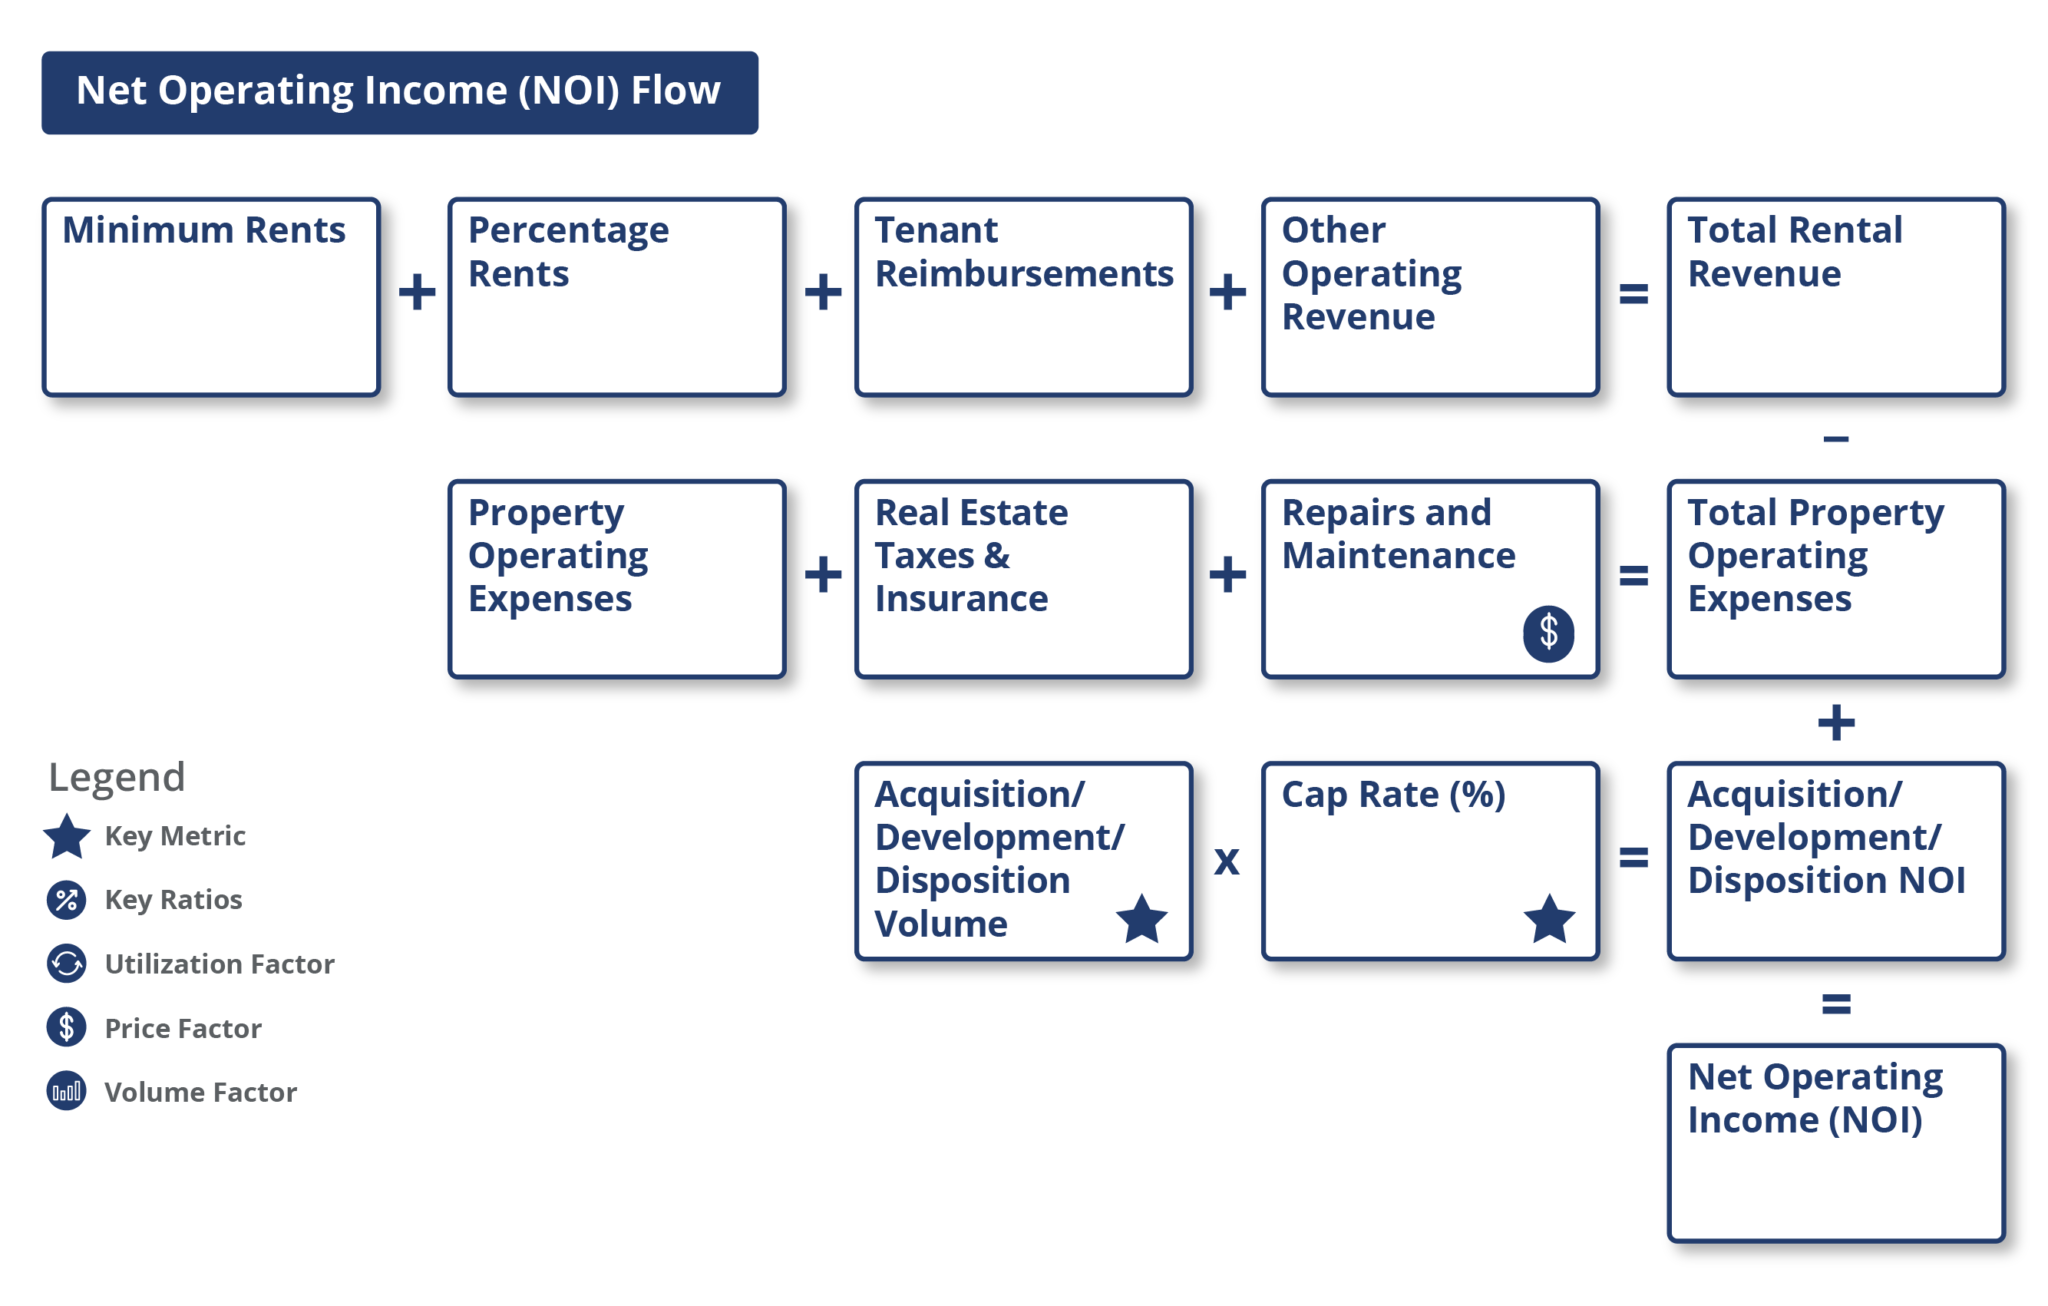
Same-store net operating income (NIO) growth is a key measure of profitability for a retail REIT. It is growth that excludes certain non-cash and non-comparable items. Same-store NOI is calculated as same-store revenues minus same-store operating expenses, including property taxes.
Acquisition Rate
Acquisition rate refers to the yield that is generated from an acquired property.
Acquisition Volume
Acquisition volume refers to the additions to a retail REIT’s portfolio of investment properties. This may take the form of transactions in real estate.
Development Rate
Development rate refers to yield that is generated from a property in development.
Development Volume
Development volume is a measure of a new construction or previously agreed upon re-developments.
Disposition Rate
Disposition rate refers to yield that is generated from a disposed property.
Disposition Volume
Disposition volume refers to the sale of real estate holdings by retail REITs.
Capitalization Rate (%)
Capitalization rate, or cap rate, is the initial yield on a real estate investment. Cap rate is computed by dividing the cash flow in year 1 by either the acquisition/disposition price or the total expected development cost.
Total Square Feet (K)
Total square feet (K) is the total amount of floor space available for rent to retail tenants.
Square Feet of Expiring Lease (K)
Square feet to expiring lease (K) is the number of square feet of lease which is expiring in a period.
Expiring Rent Per Square Feet
Expiring rent per square foot is the rent per square foot at the time of expiration of the lease.
New Rent Per Square Feet
New rent per square foot is the rent per square foot at the time of the new lease.
Total Potential Roll-up/Down Per Square Feet
Total potential roll-up/down per square feet is the difference between rent per square foot at the time of a new lease vs an expiring lease.
Average Lease Term (Years)
Average lease term (years) measures the average period during which all leases in a retail REIT’s property or portfolio will expire.
Average Cost of Debt (%)
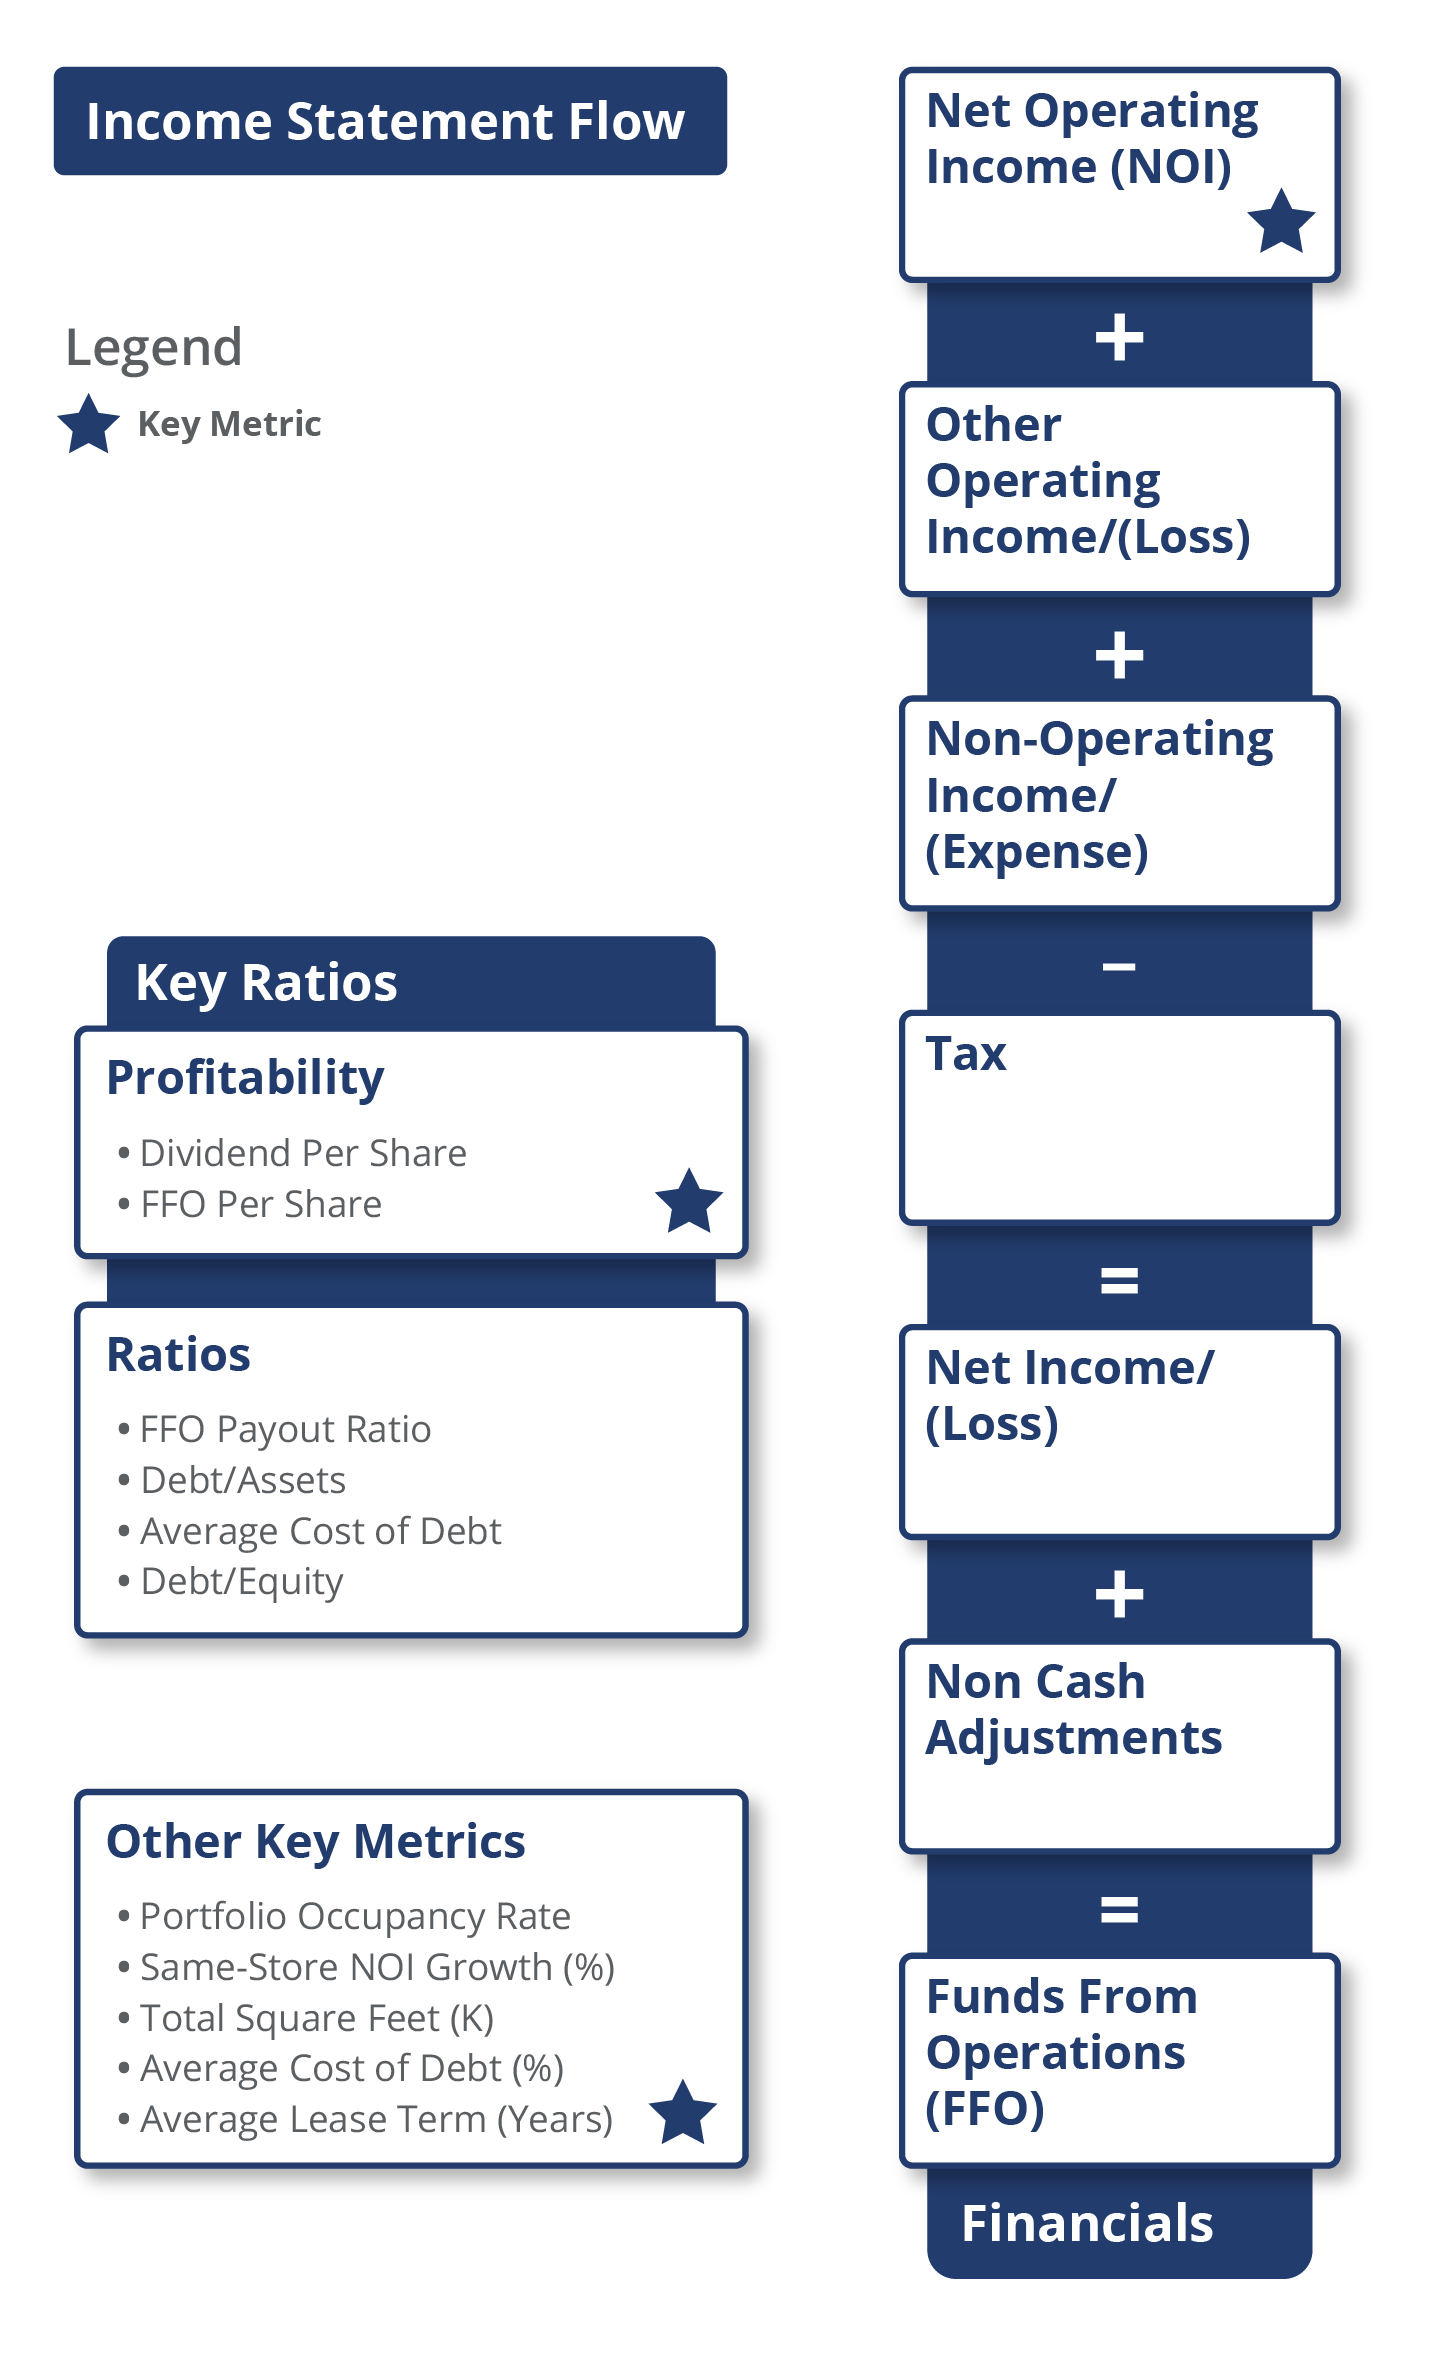
Average cost of debt (%) is a measure of the average interest rate paid to fund a retail business. It is calculated as interest expense paid divided by average debt (secured and unsecured loans and revolving credit facilities)
Download this guide as an ebook today:
Guide to Retail REITs Industry KPIs for Investment Professionals
This guide highlights the key performance indicators for the retail REITs industry and where investors should look to find an investment edge, including:
- Retail REITs Industry Business Model & Diagram
- Key Retail REITs Metrics PLUS Visible Alpha’s Standardized Industry Metrics
- Available Comp Tables
- Industry KPI Terms & Definitions
