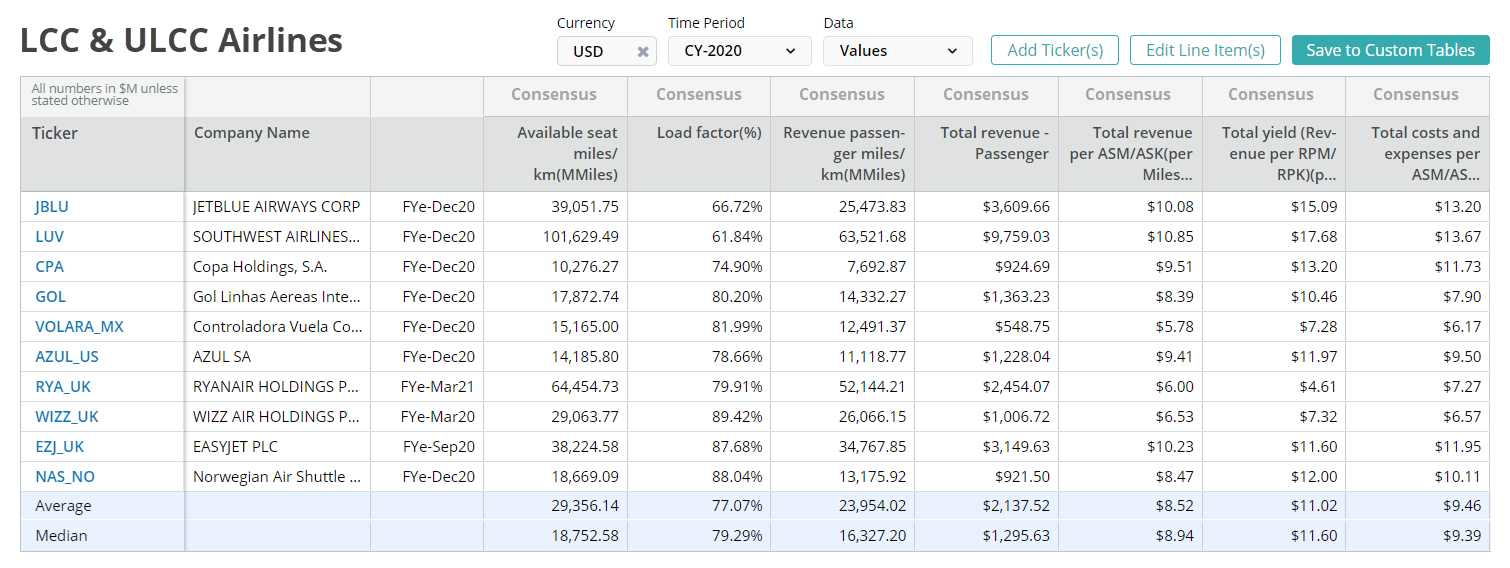
Available seat miles is a measure of airline capacity and is calculated by taking the number of seats available and multiplying by the distance flown.
Airline Business Model
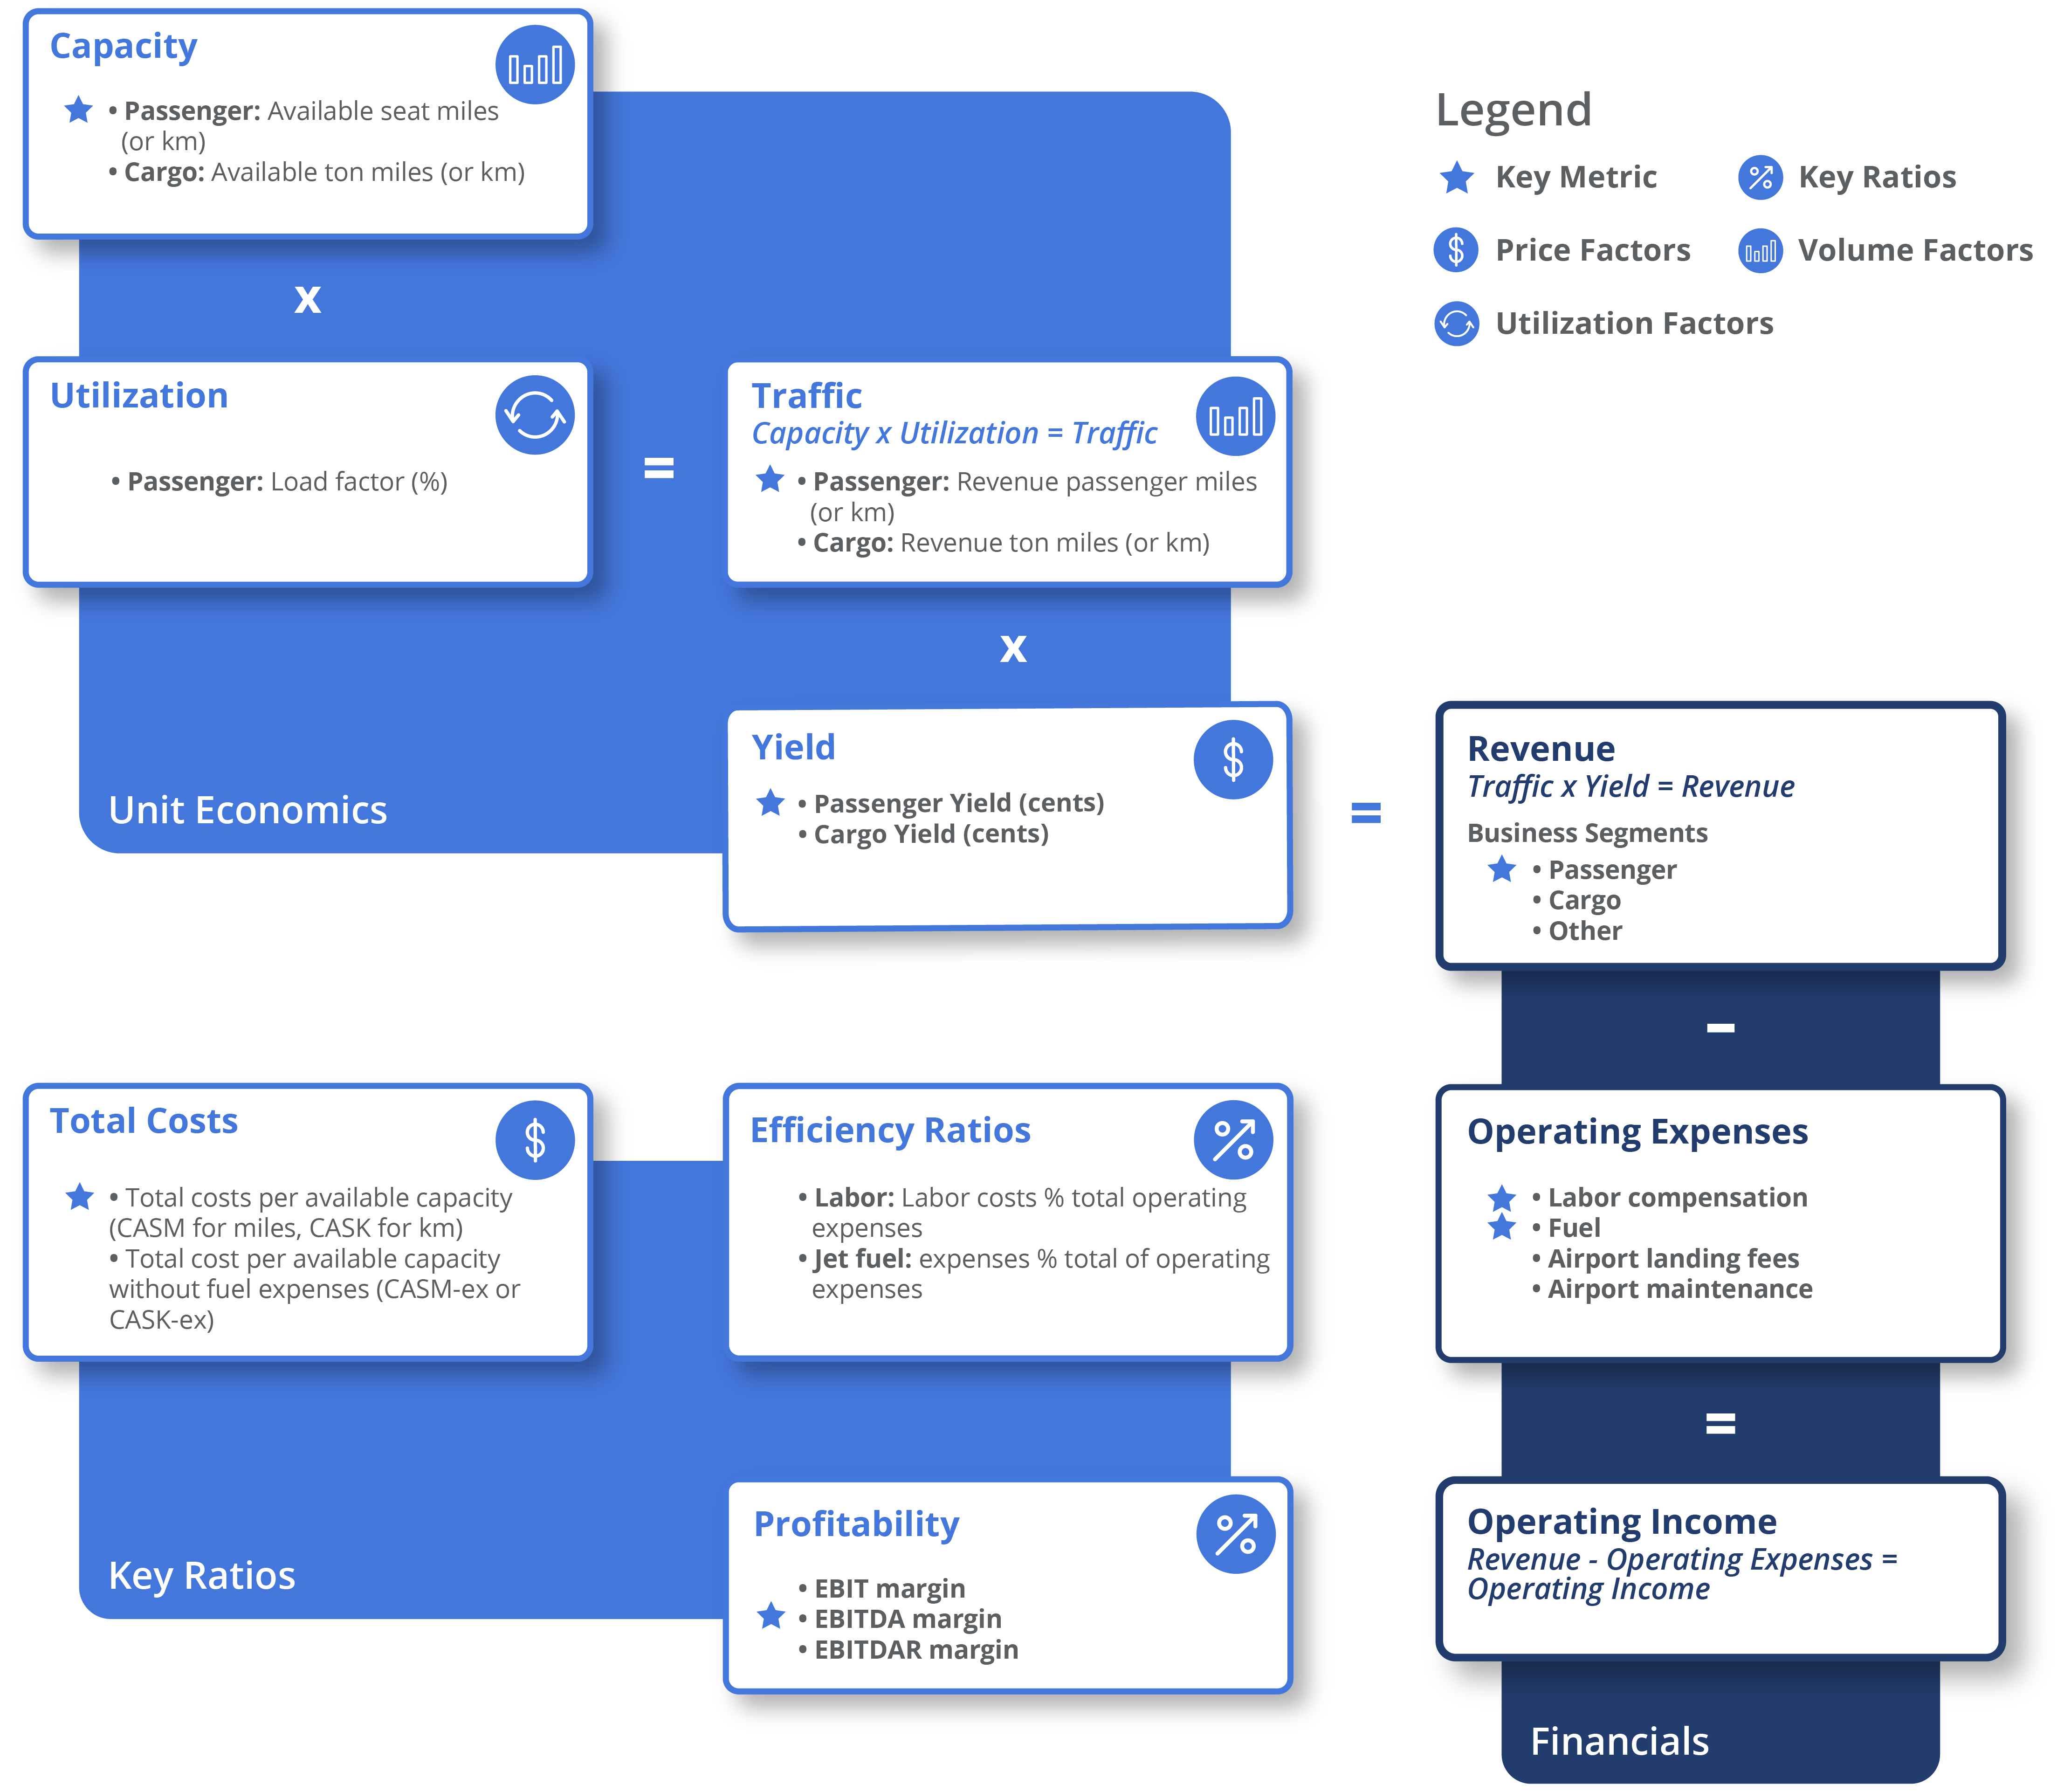
Capacity metrics like available seats miles (ASM) are often analyzed in order to get a sense of seat supply and its implications on pricing. Capacity is multiplied by a utilization metric (load factor) to arrive at revenue passenger miles (RPM), a metric for the number of passenger miles that generate revenue. RPM is multiplied by a yield metric (passenger yield) to arrive at total revenue for passengers. A similar calculation is often done for the cargo revenue as well. The addition of both passenger and cargo revenue leads to total revenue.
A number of expenses are subtracted from the revenue. Labor, fuel, airport landing fees and maintenance costs are all important expenses for an airline. CASM-Ex captures all costs excluding fuel on a per available seat mile basis.
For profitability, EBIT, EBITDA and EBITDAR are all a focus. EBITDA is looked at due to the industry’s high depreciation and amortization costs, while EBITDAR is also analyzed to normalize for each company’s different accounting treatments of their rent expenses.
Airlines are generally modeled on a per available seat mile (ASM) or kilometer (ASK) basis in order to analyze the unit economics of each business. Revenue is often looked at on a revenue per available seat mile basis (RASM) or passenger revenue per available seat mile (PRASM) basis.
Key performance indicators (KPIs) are the most important business metrics for a particular industry. When understanding market expectations for airlines, whether at a company or industry level, here are some of the airline KPIs to consider:
Visible Alpha’s Standardized Industry Metrics
To understand market expectations for the airline industry, a key information source is sell-side analyst estimate and consensus forecast data. The buy side, sell side and public companies leverage this type of data to conduct competitive analysis, a type of analysis conducted by professional analysts that involves comparing standardized metrics of one company with those of similar companies. Because companies report metrics differently – and sometimes report on different metrics altogether – standardizing the key metrics for each company can be a cumbersome process.
Visible Alpha Insights includes analyst data, company data and industry data at level of granularity unparalleled in the market. Our industry data – Standardized Industry Metrics – enables market participants to quantify and compare market expectations for companies across 184 industries.
Data as of January 2023
Airline Industry KPI Terms & Definitions
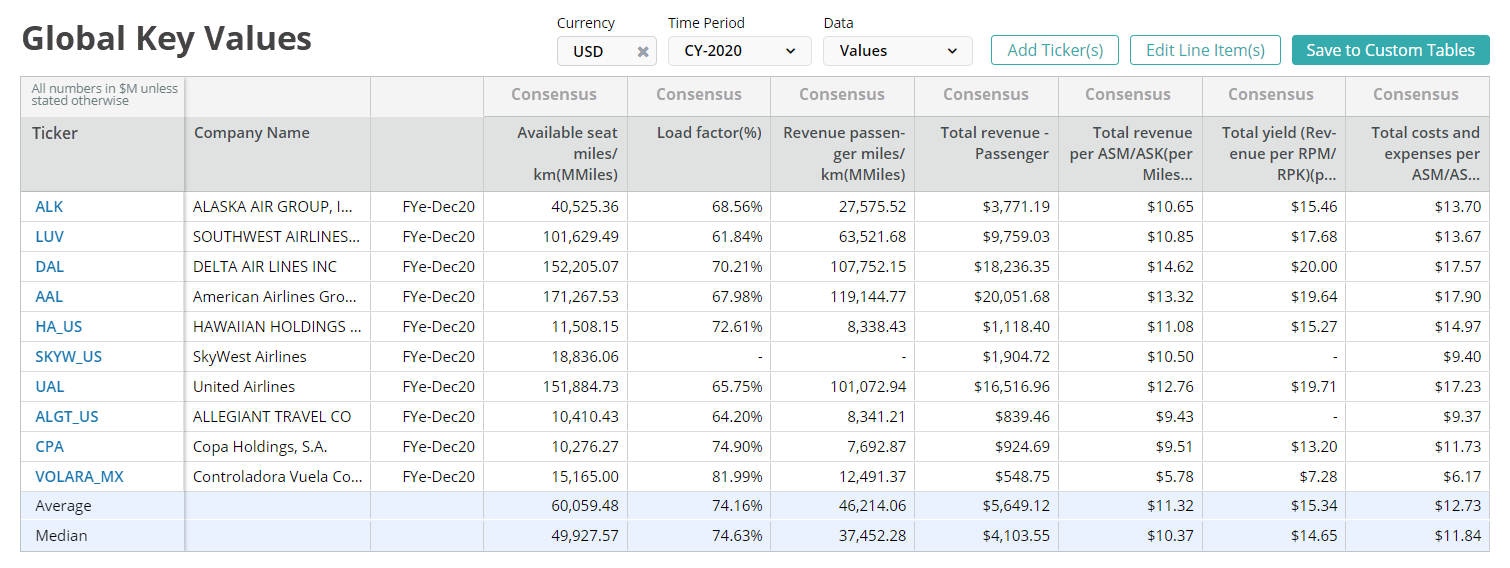
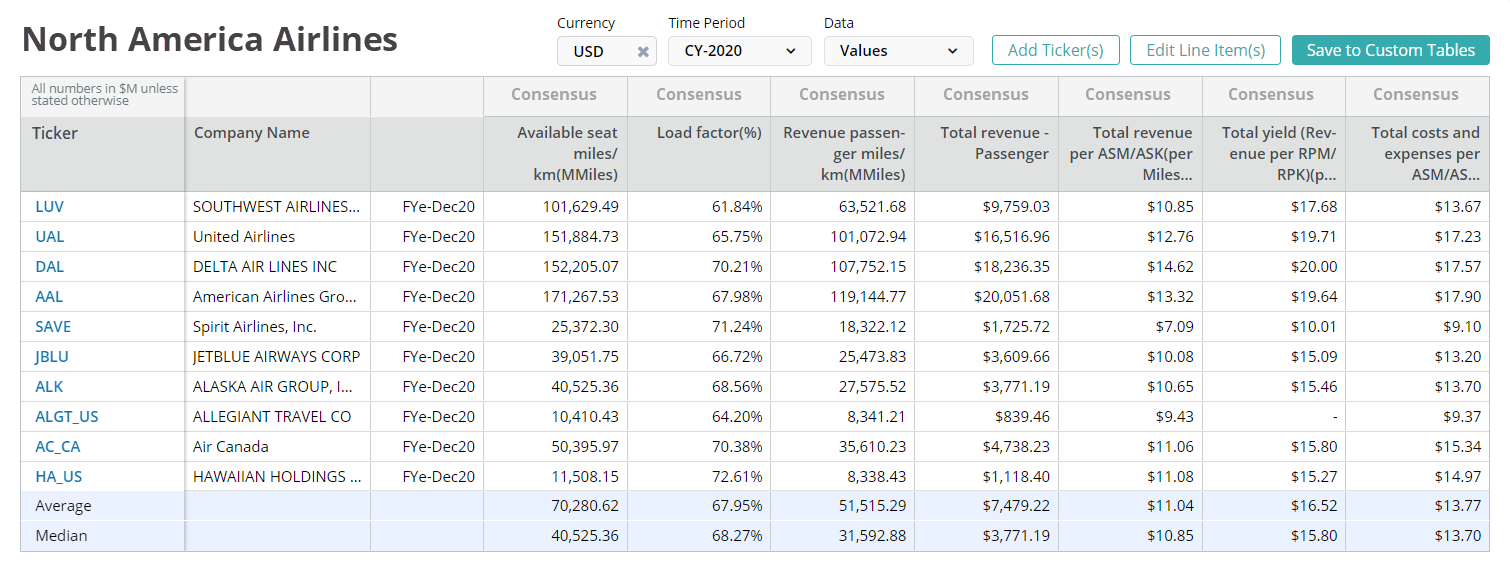
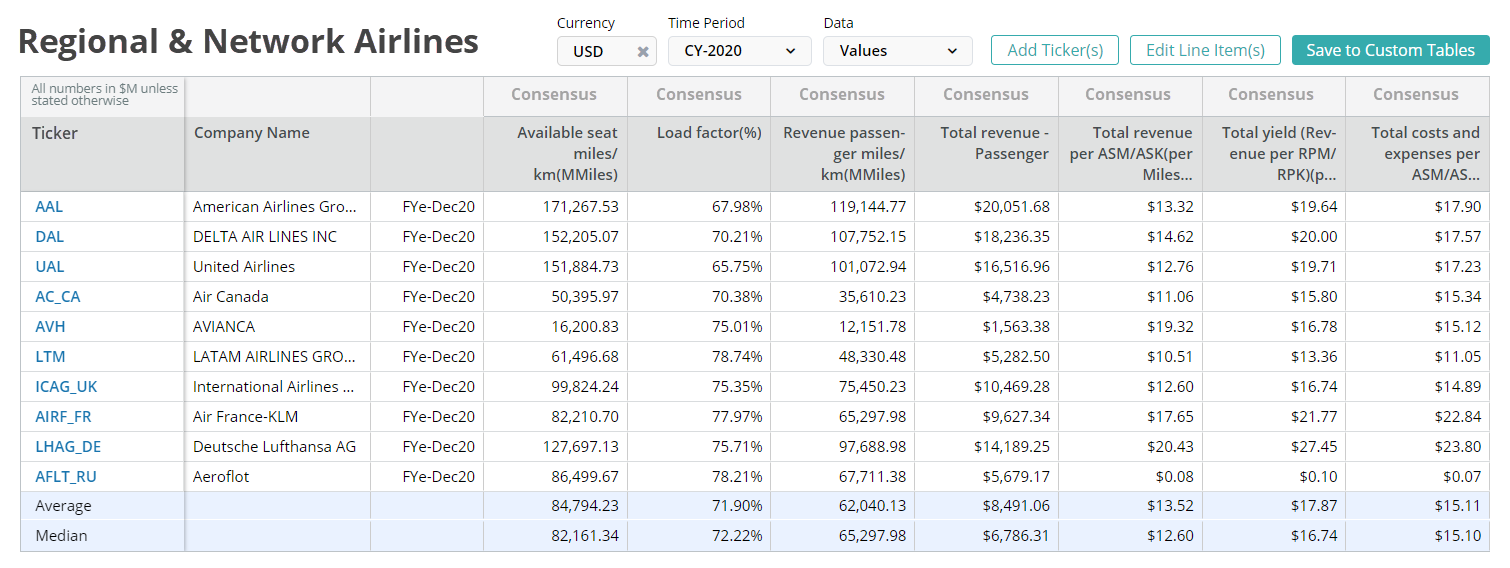
Visible Alpha offers an innovative, integrated experience through real-time, granular consensus estimates and historical data created directly from the world’s leading equity analysts. Using a subset of the below KPIs, this data can help investors hone in on the key drivers of companies to uncover investment opportunities. Learn More >
Available Seat Miles (ASM)
Available seat miles is a measure of airline capacity and is calculated by taking the number of seats available and multiplying by the distance flown.
Available Seat Kilometers (ASK)
Available seat kilometers is a measure of airline capacity and is calculated by taking the number of seats available and multiplying by the distance flown.
Cost per Available Seat Mile (CASM)
Cost per available seat mile is a measure of efficiency and is calculated by taking operating expenses and dividing by ASM.
Cost per Available Seat Kilometer (CASK)
Cost per available seat kilometer is a measure of efficiency and is calculated by taking operating expenses and dividing by ASK.
Revenue per Available Seat Mile (RASM)
Revenue per available seat mile is calculated by dividing the airline’s total revenue by its total available seat miles.
Revenue per Available Seat Kilometer (RASK)
Revenue per available seat kilometer is calculated by dividing the airline’s total revenue by its total available seat kilometers.
Passenger Load Factor
Passeneger load factor is a measure of utilization, passenger load factor is the number of Revenue Passenger Miles (or Kilometers) expressed as a percentage of ASMs (or ASKs).
Airport Charges
Airport charges are expenses paid by airlines for the use of airport facilities, including aircraft landing, freight and other charges related to the use of airport infrastructure such as runways and terminals.
Passenger Yield (in miles)
Passenger yield is a measure of average fare paid per mile, per passenger, calculated by dividing passenger revenue by revenue passenger miles (RPMs).
Passenger Yield (in kilometers)
Passenger yield is a measure of average fare paid per mile, per passenger, calculated by dividing passenger revenue by revenue passenger kilometers (RPKs).
Total Revenue per Available Seat Mile (TRASM)
Total revenue per available seat mile is calculated by dividing total revenue by available seat miles.
Total Revenue per Available Seat Kilometer (TRASK)
Total revenue per available seat kilometer is calculated by dividing total revenue by available seat kilometers.
Passenger Revenue per Available Seat Mile (PRASM)
Passenger revenue per available seat measured is calculated by dividing passenger revenue by available seat miles. PRASM is also equivalent to the product of load factor and passenger yield.
Passenger Revenue per Available Seat Kilometer (PRASK)
Passenger revenue available per seat kilometer is calculated by dividing passenger revenue by available seat kilometers. PRASK is also equivalent to the product of load factor and passenger yield.
Revenue Passenger Miles (RPM)
Revenue passenger miles is a measure of volume and is calculated by taking the number of passengers and multiplying by miles of flight.
Revenue Passenger Kilometers (RPK)
Revenue passenger kilometers is a measure of volume and is calculated by taking the number of passengers and multiplying by kilometers of flight.
CASM-Ex Fuel (CASM-Ex)
CASM-Ex Fuel is calculated by taking operating expenses, dividing by ASM and then subtracting the cost of fuel.
CASK-Ex Fuel (CASK-Ex)
CASK-Ex Fuel is calculated by taking operating expenses, dividing by ASK and then subtracting the cost of fuel.
EBITDAR
Earnings before interest, taxes, depreciation, amortization, and restructuring or renting costs.
Download this guide as an ebook today:
Guide to Airline KPIs for Investment Professionals
This guide highlights the key performance indicators for the airline industry and where investors should look to find an investment edge, including:
- Airline Industry Business Model & Diagram
- Key Airline Metrics PLUS Visible Alpha’s Standardized Industry Metrics
- Available Comp Tables
- Industry KPI Terms & Definitions

