Traffic growth refers to the growth in the number of customers visiting a retailer’s stores. It is one of the most important factors in assessing retailer revenue as higher store traffic leads to higher sales.
Key performance indicators (KPIs) are the most important business metrics for a particular industry. When understanding market expectations for the retail industry, whether at a company or industry level, here are some of the retailer KPIs to consider:
Visible Alpha’s Standardized Industry Metrics
To understand market expectations for the retail industry, a key information source is sell-side analyst estimate and consensus forecast data. The buy side, sell side and public companies leverage this type of data to conduct peer analysis, a type of analysis conducted by professional analysts that involves comparing standardized metrics of one company with those of similar companies. Because companies report metrics differently – and sometimes report on different metrics altogether – standardizing the key metrics for each company can be a cumbersome process.
Visible Alpha Insights includes analyst data, company data and industry data at level of granularity unparalleled in the market. Our industry data – Standardized Industry Metrics – enables market participants to quantify and compare market expectations for companies across 150+ industries.
Data as of January 2023
Industry KPI Terms & Definitions
Retailers
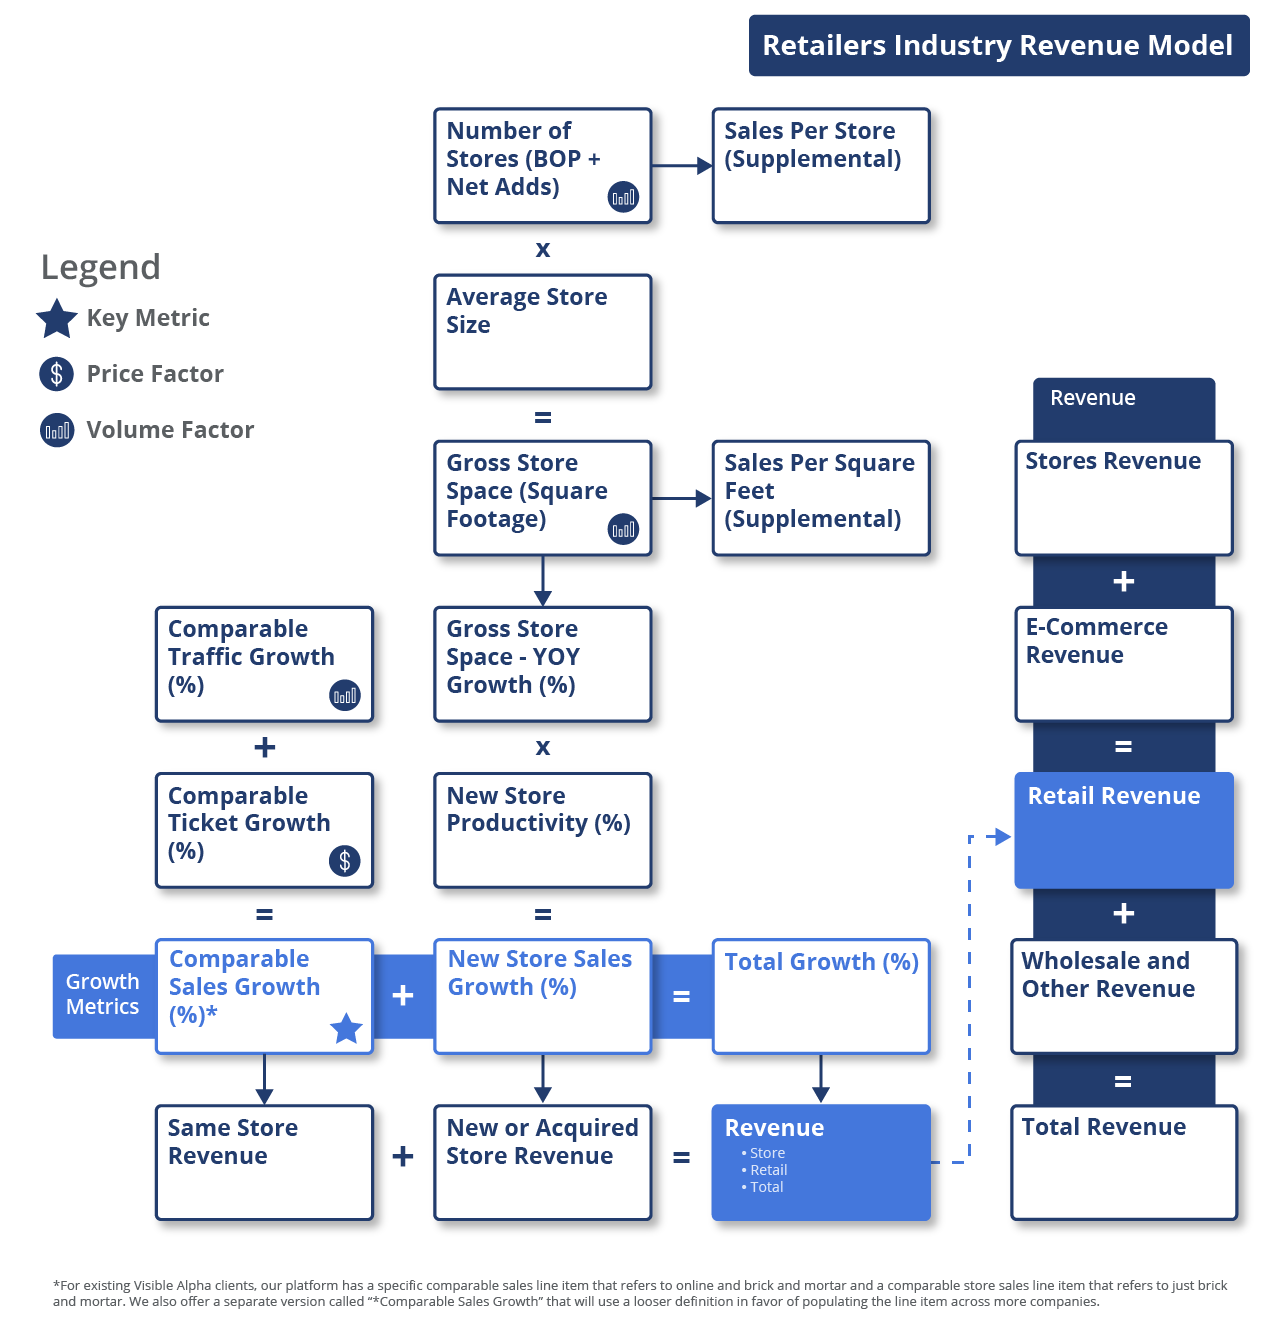
Traffic Growth
Traffic growth refers to the growth in the number of customers visiting a retailer’s stores. It is one of the most important factors in assessing retailer revenue as higher store traffic leads to higher sales.
Ticket Growth
Ticket growth refers to the growth in average spending per customer. Ticket denotes the amount each customer spends per visit.
Comparable-Store Sales Growth
Comparable or same-store sales growth refers to the revenue growth of stores that are open and operated by a retailer for more than one year. The ‘more than one-year’ criteria and the inclusion of ecommerce sales in comparable-store sales growth varies across retailers. This metric is used to determine the performance of the existing operational store.
New Stores Sales Growth
New or acquired store sales growth refers to the revenue growth contribution of stores that are operated by a retailer for less than one year. Often retailers include the 53rd week and other impacts in new store sales growth.
Number of Stores
Number of stores is the total number of stores that are operated by a retailer at the end of a given period.
Store Space
Store space is the square feet area of a retailer’s store. There are two types of square feet information that a retailer reports, gross square feet and selling square feet. Selling store space includes the selling area of a store such as the in-store space where the products are displayed and the checkout area. Gross store space also includes the non-selling area such as the kitchen, break rooms used by staff, storage areas, administrative areas, elevators, washrooms, and so on.
Average Store Size
Average store size is the average square feet or average space per store.
New Store Productivity
New store productivity measures the sales generation efficiency of new stores. It is calculated as new store sales divided by the increase in the area of stores added.
Store Sales
Store sales are sales that a retailer generates through a store-based model, rather than an ecommerce model.
Ecommerce Sales
Ecommerce sales is the revenue generated from the sale of goods or services through an online platform.
Retail Sales
Retail sales is the sum of stores-based and ecommerce sales of a retailer..
Wholesale and Other
Wholesale and other sales include revenue generated from the distribution of products to businesses or franchisees, which then sell to the end consumers.
Automotive Retailers
New Vehicle
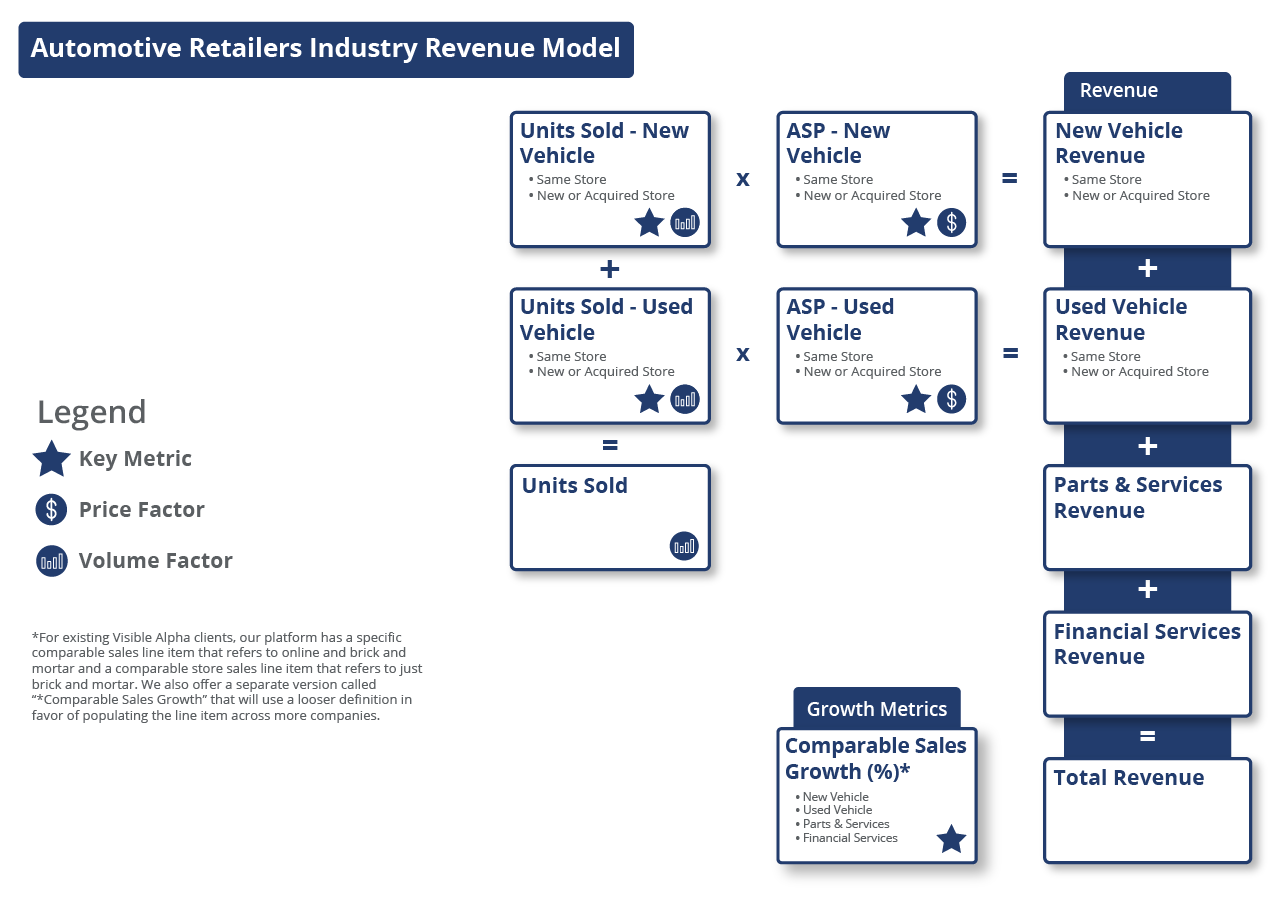
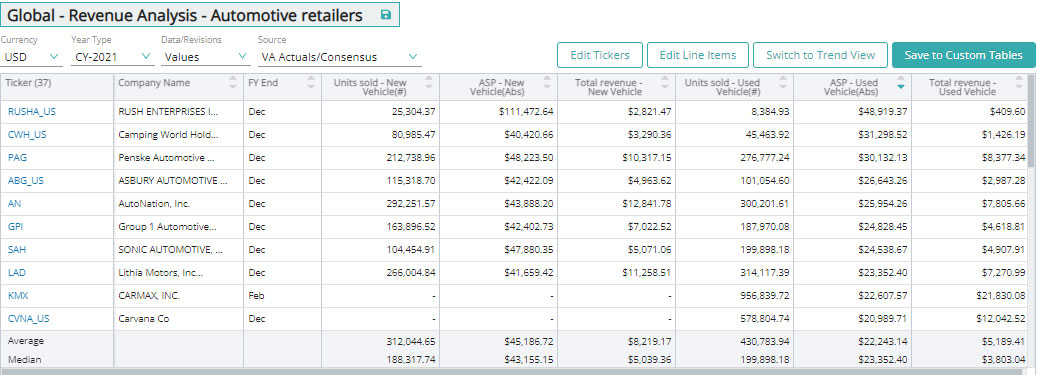
New vehicles are brand new vehicle units sold by an automotive retailer. Automotive retailers purchase the inventory either directly from the automotive manufacturers or from distributors or sometimes also via dealer trades from other retailers.
Used Vehicle
Used vehicles are pre-owned vehicle units sold by an automotive retailer. Automotive retailers generally purchase their inventory from used vehicle wholesalers, customers who buy new vehicles in exchange for old ones, as well as from vehicle auctions.
Parts and Service
The parts and service business line involves retailing and wholesaling of maintenance and repair of automotive parts, as well as providing maintenance and repair services.
Financial Services
Financial services include the automotive financing and insurance offerings of automotive retailers. Financial services may also include loans and/or leases arranged via third-party lenders.
Units Sold
Units sold is the number of vehicle units sold by an automotive retailer in a given period.
Average Selling Price (ASP)
Average selling price (ASP) is the average price at which a unit of a vehicle is sold.
Comparable-Store Sales Growth
Comparable or same-store sales growth refers to the revenue growth of stores that are open and operated by a retailer for more than one year. The ‘more than one-year’ criteria and the inclusion of ecommerce sales in comparable-store sales growth varies across retailers. This metric is used to determine the performance of the existing operational store.
Online Retailers
First-Party (1P)
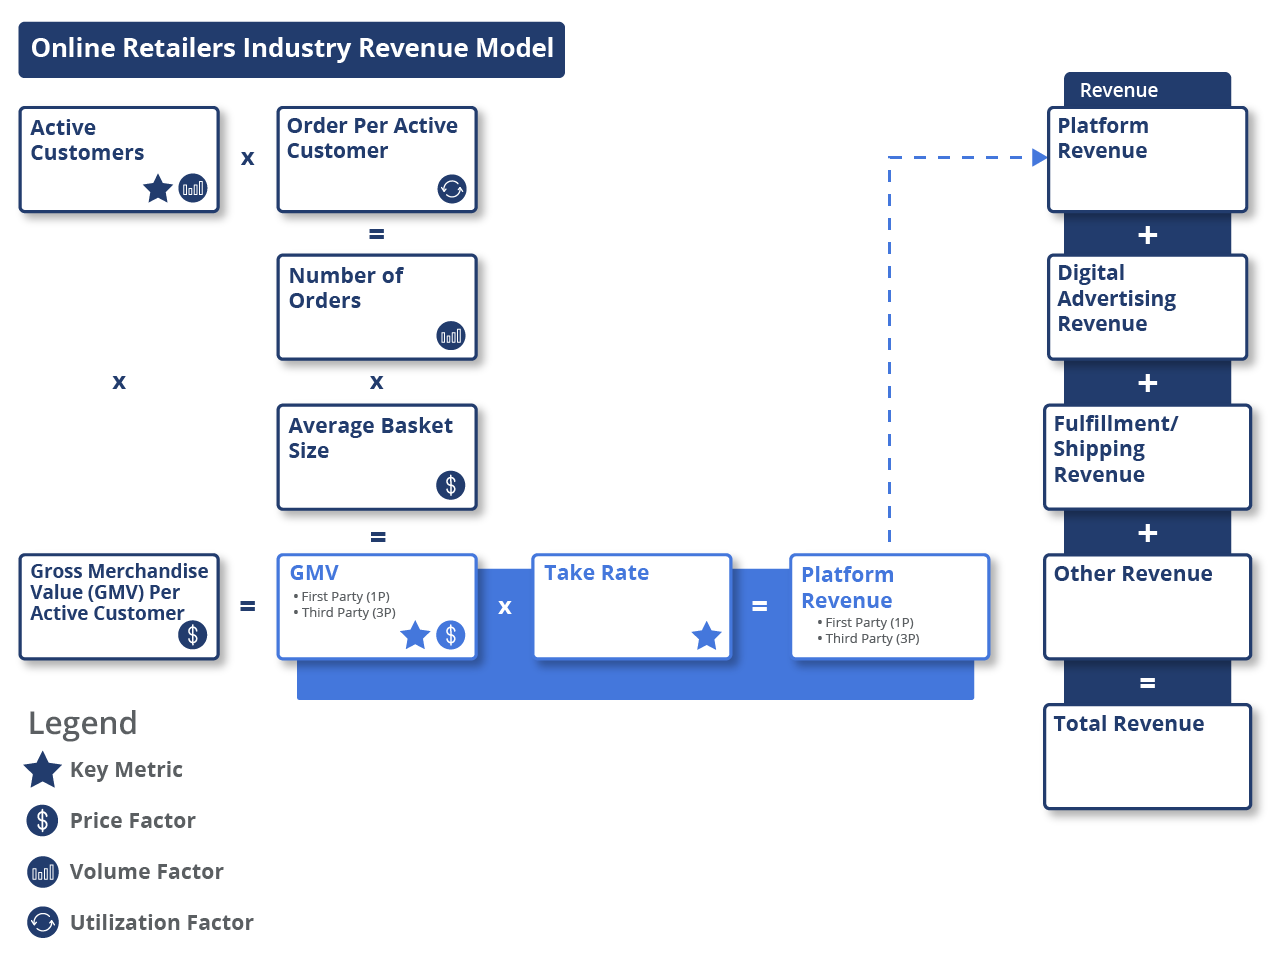
First-party operations involve inventory that is purchased from a manufacturer or wholesaler, is stocked, and then sold and shipped to the end customer. In 1P operations, the company has ownership rights and may sell the products under its own label and price.
Third-Party (3P)
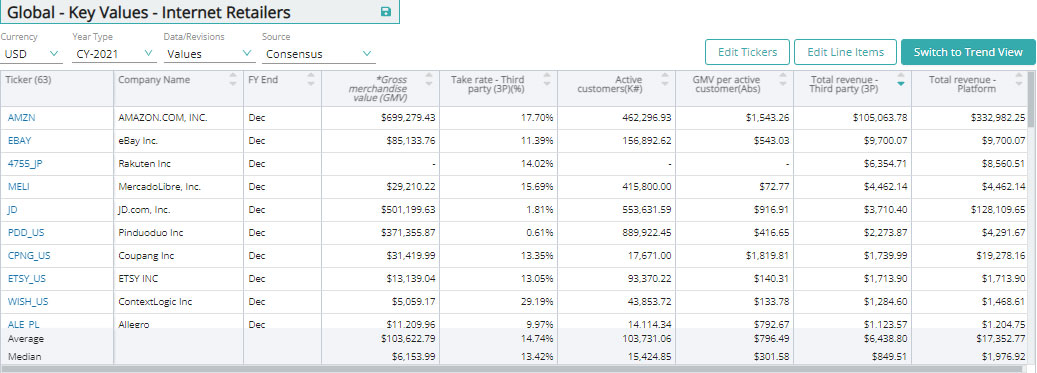
Third-party operations involve inventory or services that are listed on a marketplace by suppliers. The marketplace will then charge a commission fee based on a percentage of the gross merchandise value.
Platform Revenue
Platform revenue is the core revenue earned from the sale of products/services via a retailer’s online platforms, mainly websites or apps. The value is generally a sum of first and third-party revenue and may include part of shipping revenue as well.
Fulfillment/Shipping Revenue
Fulfillment/shipping revenue is the revenue generated by charging fulfillment or shipping fees for orders to customers.
Digital Advertising Revenue
Digital advertising revenue is the revenue generated from providing advertising or marketing services such as performance marketing campaigns, placement of banners on the retailer’s online platform, promotional listings, and so on.
Gross Merchandise Value (GMV)
Gross merchandise value (GMV) is the overall gross transacted value of goods/services purchased by customers via a retailer’s online platform. The value is inclusive of shipping charges unless otherwise stated and taxes such as VAT.
Take Rate
Take rate is the percentage charged on GMV to a retailer’s sellers. It generally includes commission fees and shipping fees charged when the company acts as the shipping provider and other seller services. Take rate could be on a blended basis or just a 3P basis.
Active Customers
Active customers are consumers who have made a purchase from a retailer’s online platform in the last 12 months.
Number of Orders
Number of orders is the total number of orders placed by consumers on a retailer’s online platform in a given period, inclusive of gross returns and net cancellations.
Orders Per Active Customer
Orders per active customer is calculated as the number of orders divided by active customers. This metric is indicative of how frequently a customer is likely to place an order in a given period.
Average Basket Size
Average basket size refers to the GMV per order. It is the average value of all orders placed on the retailer’s online platform in a given period.
GMV Per Active Customer
GMV per active customer is the GMV divided by active customers for a given period. It indicates the gross transacted value of goods/services attributable to each customer.
Download this guide as an ebook today:
Guide to Retail KPIs for Investment Professionals
This guide highlights the key performance indicators for the retail industry and where investors should look to find an investment edge, including:
- Retail Industry Business Model & Diagram
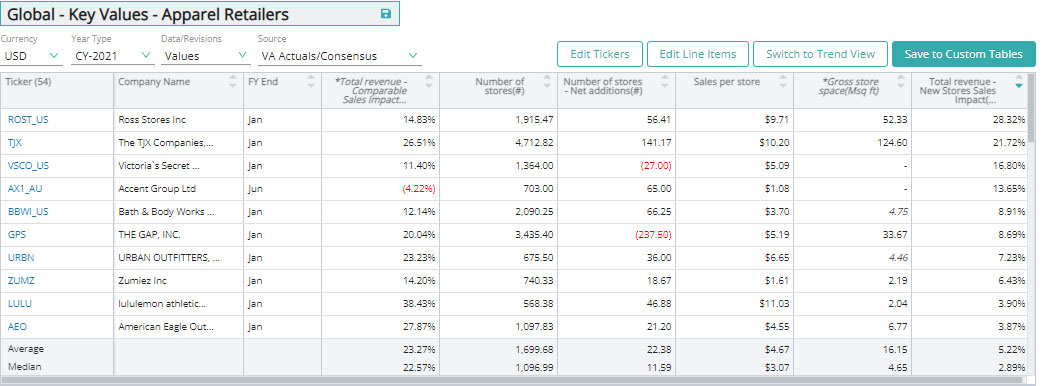
- Key Retail Metrics PLUS Visible Alpha’s Standardized Industry Metrics
- Available Comp Tables
- Industry KPI Terms & Definitions

