Digital advertising revenue refers to the revenue generated by companies through the display of paid advertisements on their websites, social media platforms, or other channels. Although, we’ve focussed on social media in this guide, digital advertising revenue need not be limited to social media platforms. This revenue is typically generated through a fixed fee charged for a specific period, the number of impressions delivered, or the number of user actions such as clicks.
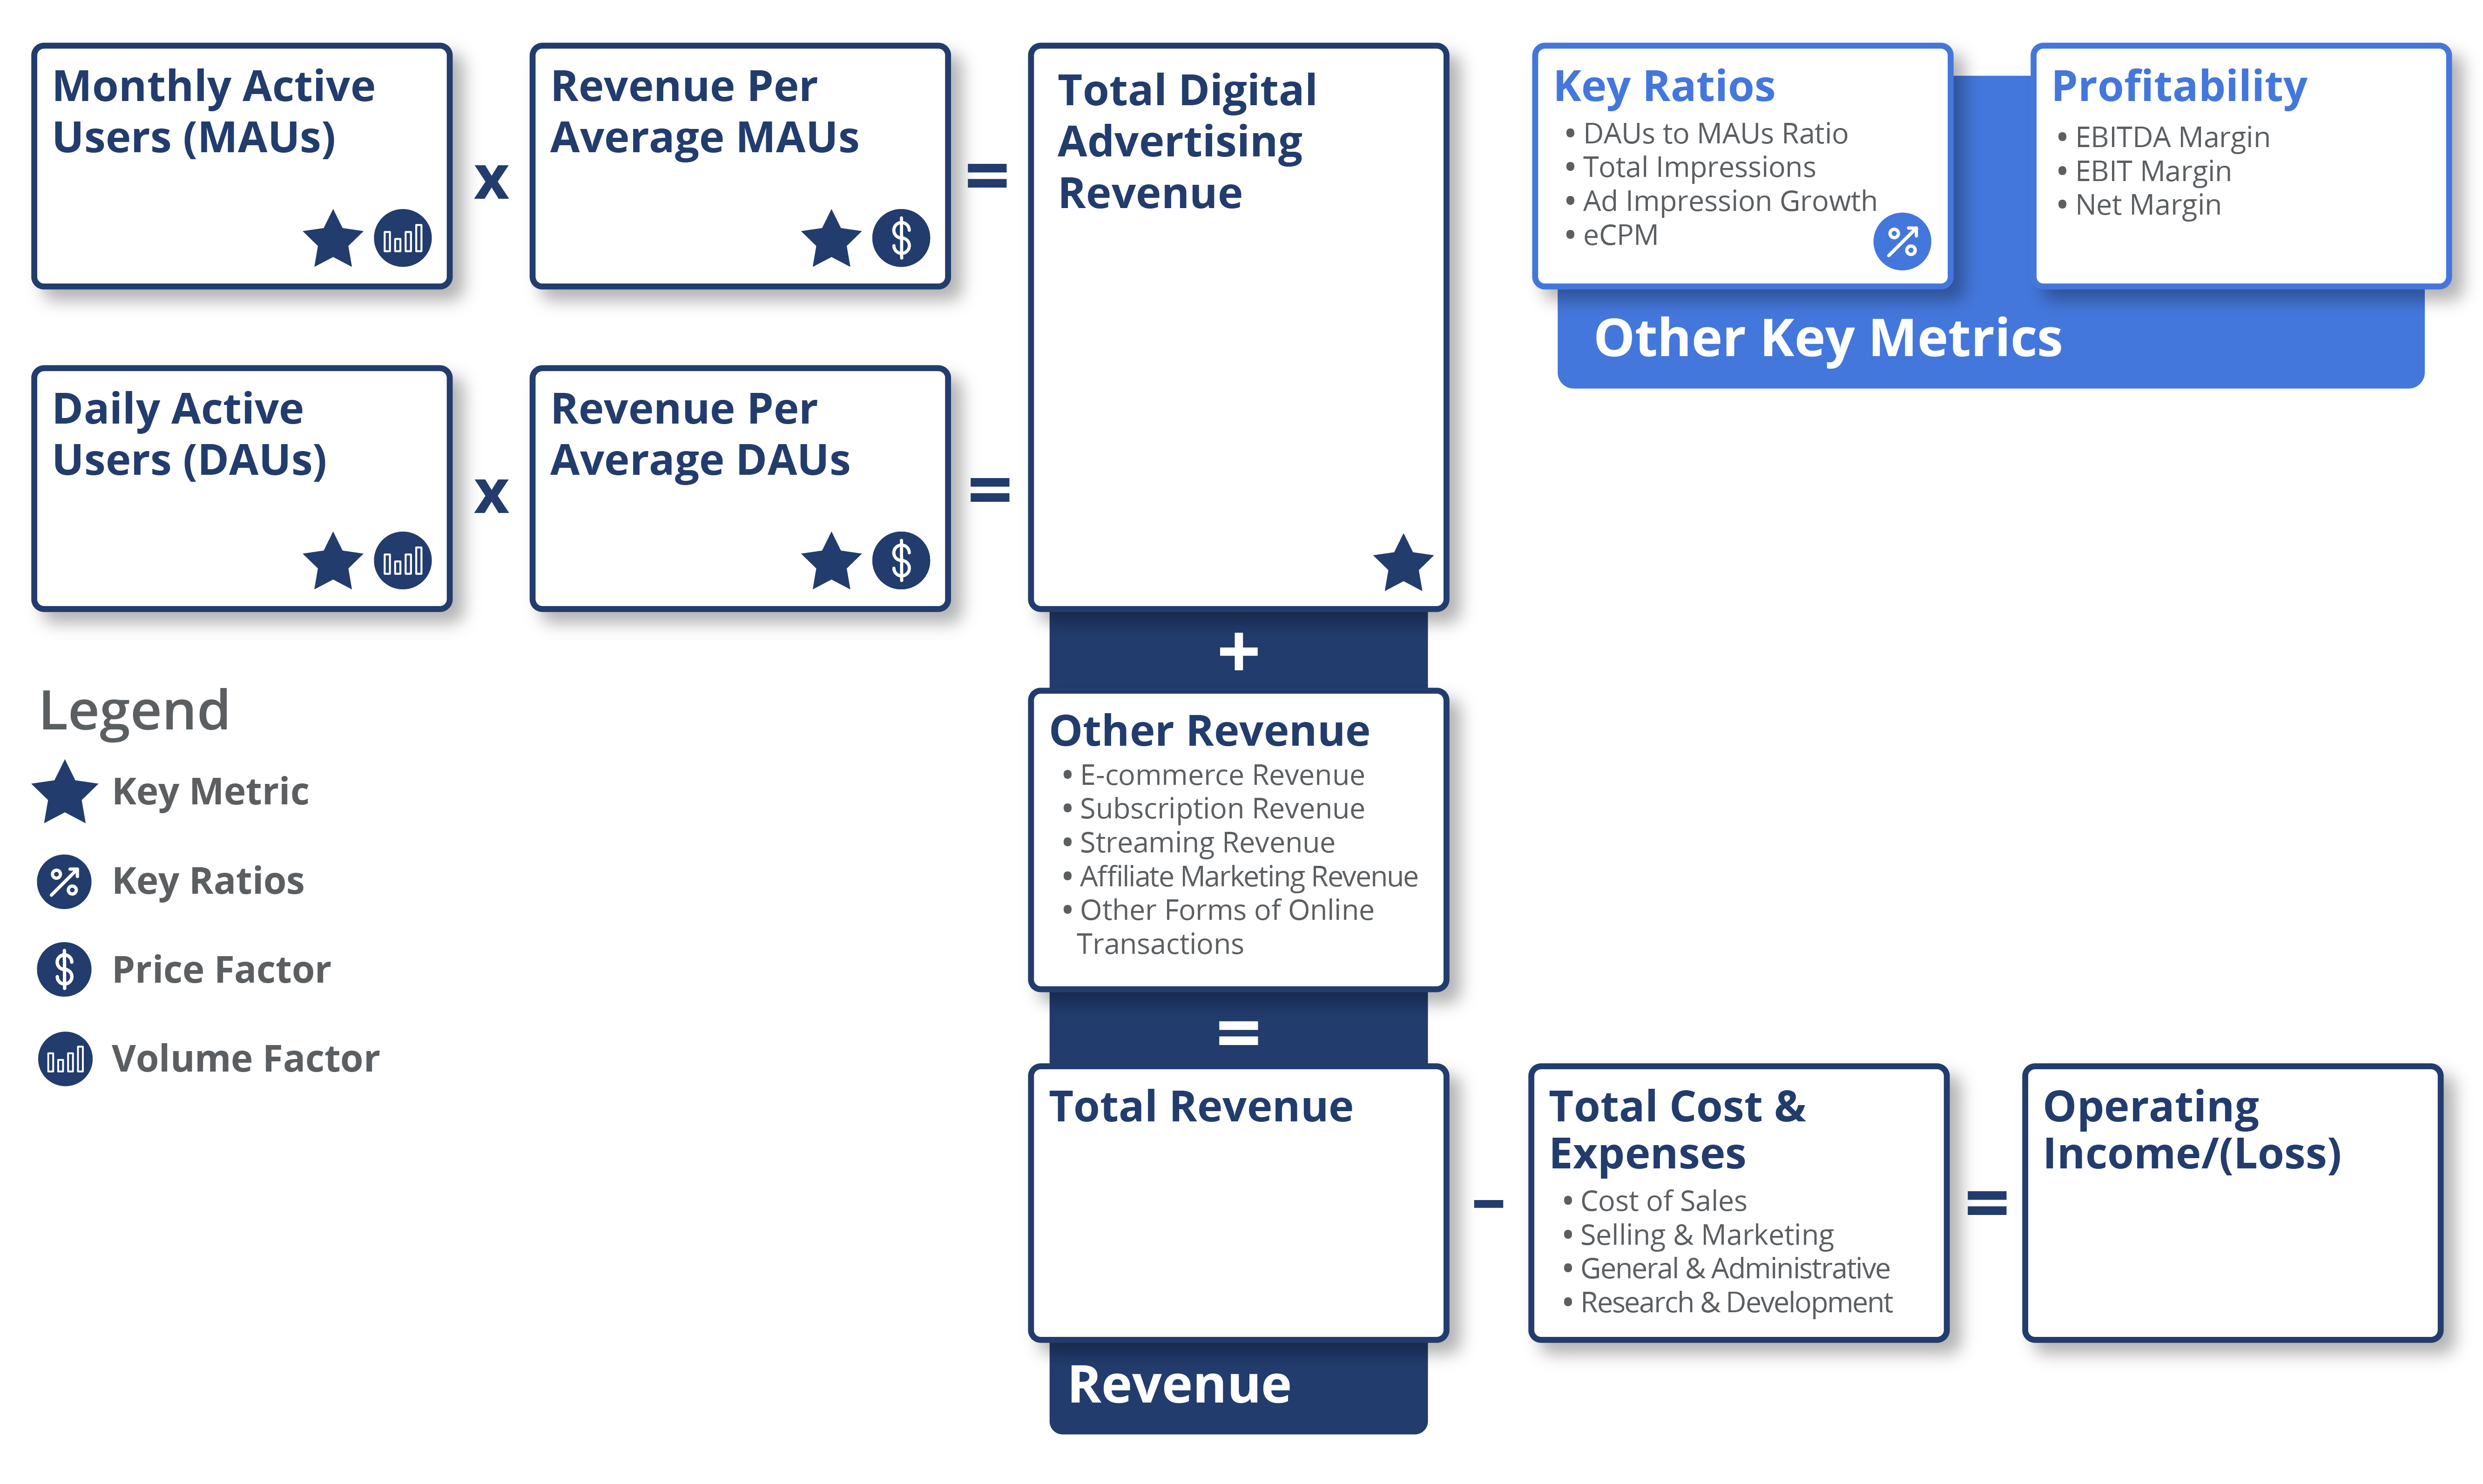
Key performance indicators (KPIs) are the most important business metrics for a particular industry. When understanding market expectations for the social media industry, whether at a company or industry level, some KPIs to consider include:
Visible Alpha’s Standardized Industry Metrics
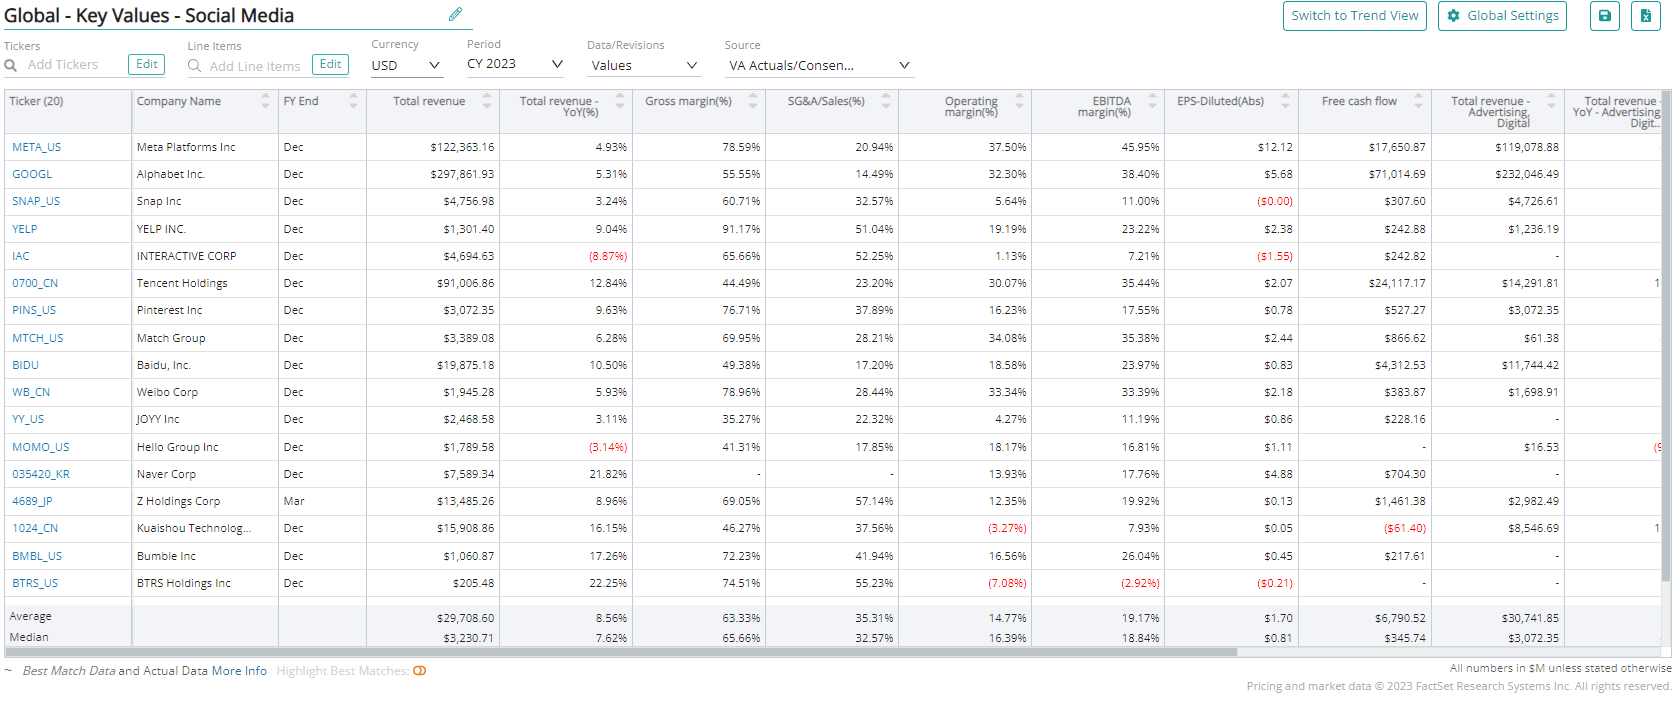
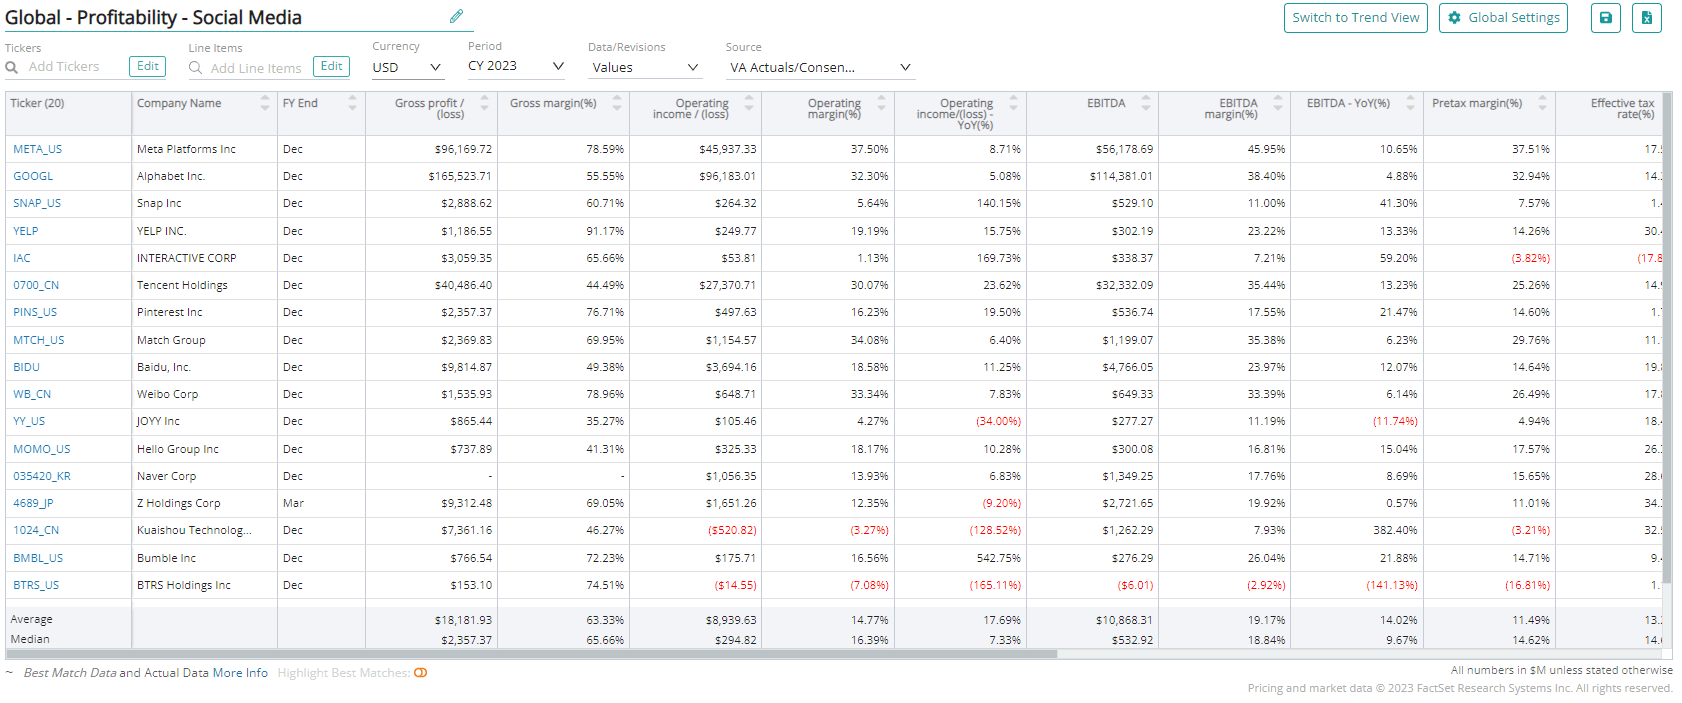
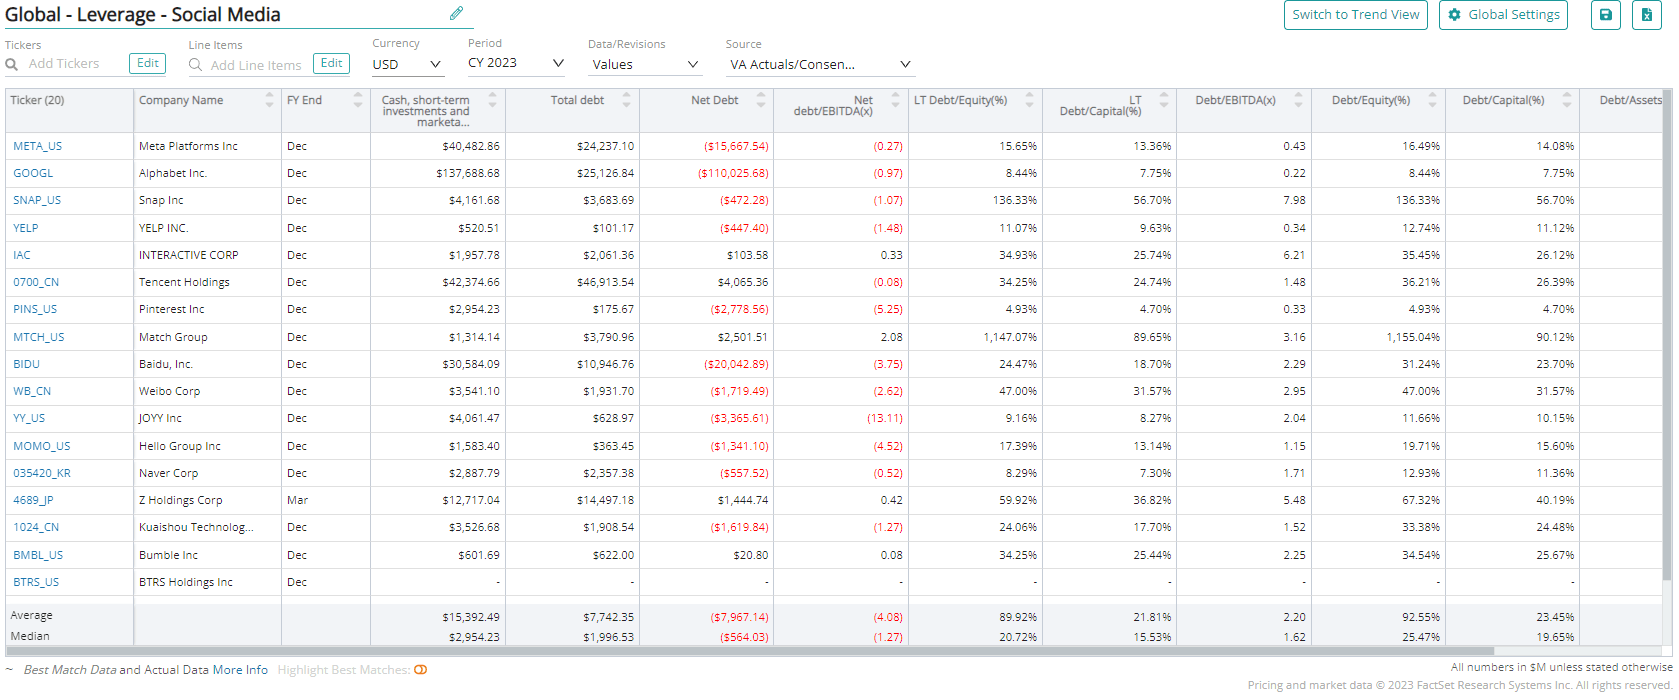
To understand market expectations for the social media industry, a key information source is sell-side analyst estimates and consensus forecast data. The buy-side, sell-side, and public companies leverage this type of data to conduct competitive analysis, a type of analysis conducted by professional analysts that involves comparing standardized metrics of one company with those of similar companies. Because companies report metrics differently – and sometimes report on different metrics altogether – standardizing the key metrics for each company can be a cumbersome process.
Visible Alpha Insights includes analyst data, company data, and industry data at a level of granularity unparalleled in the market. Our industry data – Standardized Industry Metrics – enables market participants to quantify and compare market expectations for companies across 150+ industries.
Data as of May 2023
Industry KPI Terms & Definitions
Visible Alpha offers an innovative, integrated experience through real-time, granular consensus estimates and historical data created directly from the world’s leading equity analysts. Using a subset of the below KPIs, this data can help investors hone in on the key drivers of companies to uncover investment opportunities.
Total Digital Advertising Revenue
Digital advertising revenue refers to the revenue generated by companies through the display of paid advertisements on their websites, social media platforms, or other channels. Although, we’ve focussed on social media in this guide, digital advertising revenue need not be limited to social media platforms. This revenue is typically generated through a fixed fee charged for a specific period, the number of impressions delivered, or the number of user actions such as clicks.
Monthly Active Users (MAUs)
Monthly active users (MAUs) refer to the number of unique individuals who take a specified action, such as logging in, clicking, or saving, within a 30-day period ending on the date of measurement.
Daily Active Users (DAUs)
Daily active users (DAUs) refer to the number of unique individuals who take a specified action, such as logging in, clicking, or saving, within a 24-hour period.
Number of Subscribers/Users
Number of subscribers or users reflects the number of accounts with an active subscription and the number of registered users who took some action on the platform during a specific period.
Revenue Per Average MAUs
Revenue per average MAUs is the revenue generated by a social media company in a specific period divided by the average monthly active users (MAUs).
Revenue Per Average DAUs
Revenue per average DAUs is the revenue generated by a social media company in a specific period divided by the average daily active users (DAUs).
Revenue Per Subscriber/User
Revenue per subscriber/user is the revenue generated by a social media company in a specific period divided by the number of subscribers/users.
DAU-to-MAU ratio
The daily active users (DAUs) to monthly active users (MAUs) ratio measures the stickiness of a social media platform, that is, how often people engage with it.
Impressions
Impressions refer to the number of times an ad or promoted post is retrieved from the server and displayed on a social network. It doesn’t indicate the number of unique users who have viewed the ad, but rather the number of times a user has seen it. For instance, if a single user sees the same ad multiple times over a certain time frame, each view is considered as one impression.
Ad Impressions Growth
Ad impressions growth is the growth rate in advertising impressions on a year-over-year basis.
eCPM
Effective cost per mille (thousand) impressions (eCPM) is the cost an advertiser pays for a thousand views or clicks of an advertisement.
Download this guide as an ebook today:
Guide to Social Media Industry KPIs for Investment Professionals
This guide highlights the key performance indicators for the social media industry and where investors should look to find an investment edge, including:
- Social Media Industry Business Model & Diagram
- Key Social Media Industry Metrics PLUS Visible Alpha’s Standardized Industry Metrics
- Available Comp Tables
- Industry KPI Terms & Definitions


