Make the Most of Your Time: Before, During and After Earnings
Staying on top of your coverage universe requires executing on a variety of activities before, during and after earnings season. In this case study, we explore four of these important activities and the tools that can streamline carrying them out.
1. Review Current Expectations
Situation #1:
Your company is about to release earnings and you need to know what analysts are expecting.
Situation #2:
Earnings just came out and you need to perform a quick surprise analysis to see if the company beat or fell short of analyst estimates.
Situation #3:
You are scheduled to speak with company management and want to have the key values at-a-glance.
Situation #4:
You follow a company closely and you need a read of the latest expectations for the most important values.
Actions:
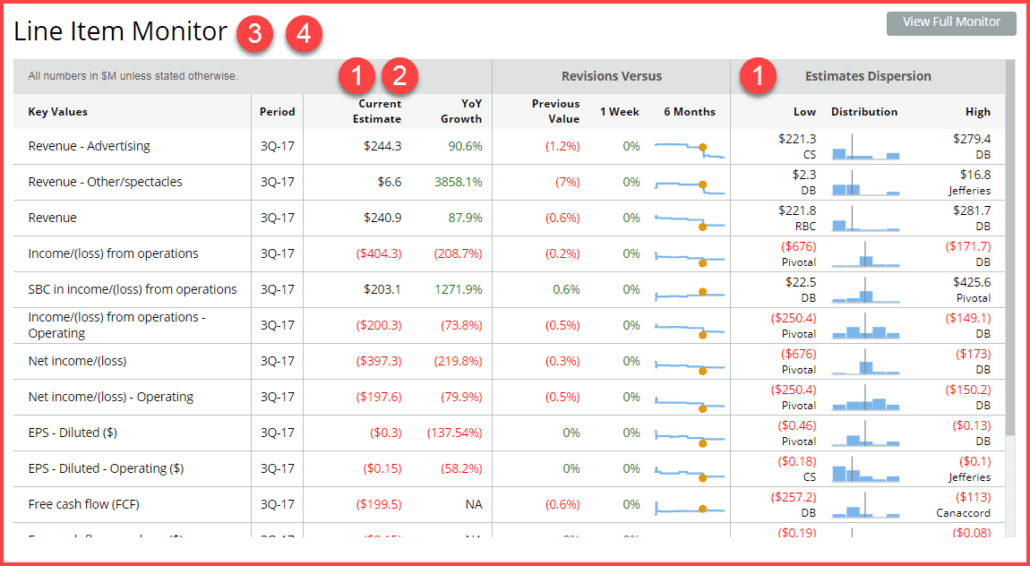
In all of these situations, you can begin by navigating to the Company Home Page for the company of interest. From there, you can see an at-a-glance view of key values, and current analyst distribution and revisions charts. With this information all in one place, you can then click into any data point or metric for expanded analysis and more customization to get to the information you need.
Visible Alpha’s Line Item Monitor for Snap, Inc.
The circled numbers indicate areas to explore to handle the situations one through four mentioned above.
Source: Visible Alpha as of September 20, 2017
2. Evaluate Changes in Earnings Expectations
Situation #1:
You need to know all the recent changes in estimates for key values.
Situation #2:
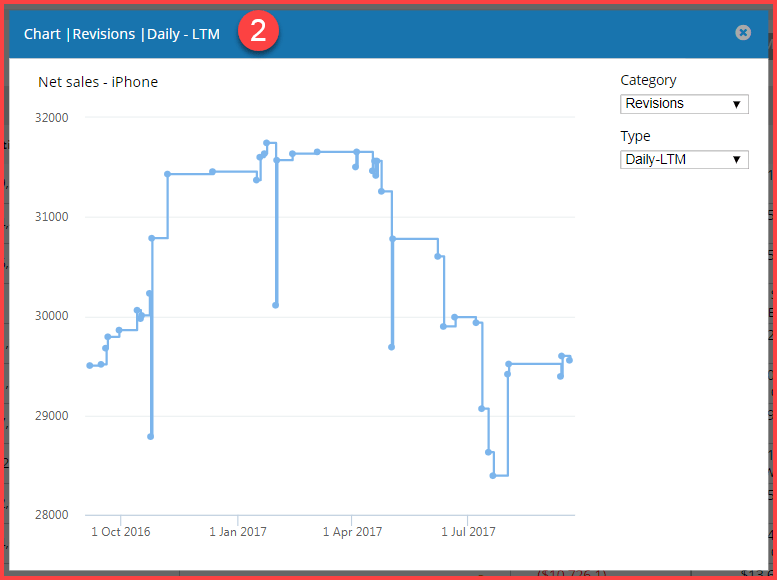
You want a summary of revisions for the past 6 months since you need to know if analysts are becoming more bullish or bearish.
Actions:
From within any Company Home Page, explore the line items of interest to you. Leverage the ‘Revisions’ column to analyze the trend and direction of recent changes in estimates.
Visible Alpha’s Line Item Monitor for Apple, Inc.

Source: Visible Alpha as of September 20, 2017
Visible Alpha’s Revisions Chart for Net Sales of Apple, Inc.’s iPhone
Source: Visible Alpha as of September 20, 2017
3. Highlight Outlier Views & Explore Estimate Distribution
Situation #1:
You need to identify analysts with outlier opinions and want to understand who has the high/low estimate so that you can contact them to understand their views.
Situation #2:
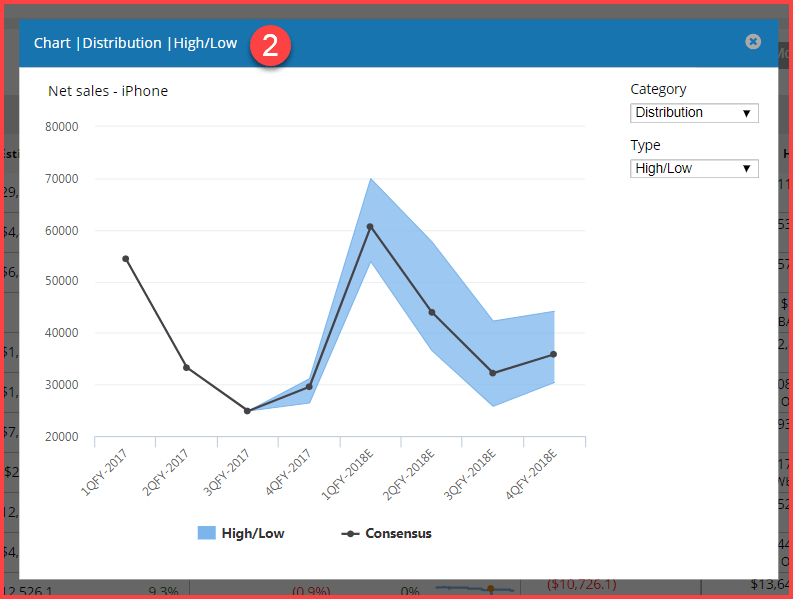
You want to see the distribution of estimates in order to understand the degree of agreement among analysts.
Actions:
Navigate to the ‘Estimates Dispersion’ column within the Line Item Monitor to see the high/low estimates and an overview of estimate distribution. Dive deeper into the data to run a High/Low analysis on the line item to see more detail beyond one line item.
Visible Alpha’s Line Item Monitor for Apple, Inc.

Source: Visible Alpha as of September 20, 2017
Visible Alpha’s Distribution Chart for Net Sales of Apple, Inc.’s iPhone
Source: Visible Alpha as of September 20, 2017
4. Customize Rows and Periods
Situation #1:
You want to be able to customize the accounts and the periods to monitor emerging trends or hot spots.
Situation #2:
You want to focus on estimates further out into the future since you are less concerned about short-term expectations.
Actions:
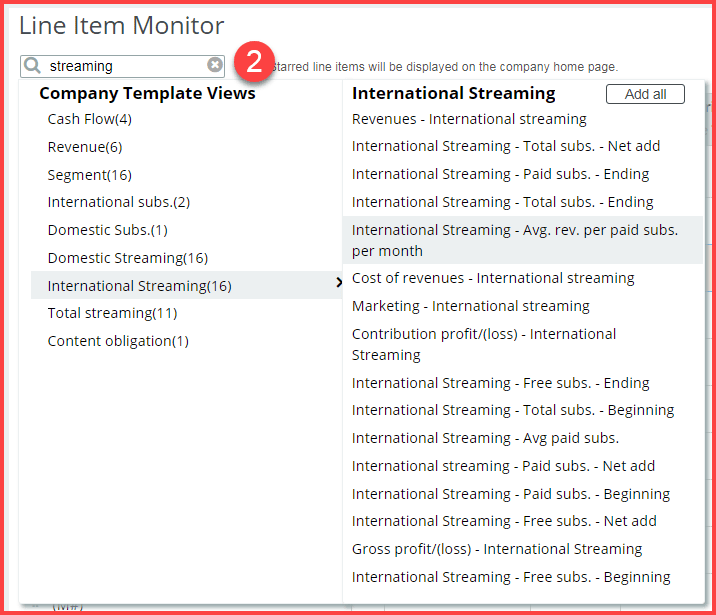
From the Full Monitor View, click into any line item to customize the quarter and year. Additionally, you can add and delete Line Items so the Line Item Monitor truly reflects the metrics and values important to you.
Visible Alpha’s Line Item Monitor for Netflix, Inc.
Use the drop-down lists to customize time periods.

Source: Visible Alpha as of September 20, 2017
Visible Alpha’s Line Item Monitor for Netflix, Inc.
Screen on any line item and add it directly into your customized view.
Source: Visible Alpha as of September 20, 2017


