The onset of earnings season can fill both the buy-side and sell-side with a bit of dread, but also with some excitement. As a former sell-side analyst, I recall the season as not only a time to update numerous Excel models and compose earnings notes, but also as an opportunity to learn. It could be a something new about the companies we covered, or an insight that could help us reevaluate our perspective on the industry or across other industries.
However, at the end of each earnings season, I often realized that I had spent more time on routine work such as earnings variance tables and earnings beats and less than an ideal amount of time on more value-added activities such as finding what was truly new about the company. From my conversations with the buy-side, I could tell that this sentiment was mutual. Faced with a deluge of pre- and post-earnings notes and models, the buy-side spent too much time filtering through the noise to find what was truly unique, and not enough time using those insights to further develop their investment thesis.
Uncovering Hidden Insights
One way to address my problem was to prepare and automate some of these tasks beforehand so that I could spend more time re-examining my investment thesis, which was more valuable for my clients than scratching my head on why the company beat on EPS for the quarter.
The buy-side can automate some of their routine work, too. If you use technology to procure and compile all the necessary data, you will find yourself with more time to analyze the information necessary to drive alpha. Having all this information accessible on a centralized platform enables you to bring more rigor to your analysis.
For example, having the ability to easily evaluate estimate trends both before and after earnings announcements can highlight changes in sell-side sentiment, and could also help distinguish proactive analysts from those simply playing catchup. Additionally, the ability to compare detailed financial numbers across several brokers side by side can help you identify analysts who have outlier calls on a stock. Having this readily available gives you time to dive deep into their projections and reconcile them with your own investment thesis.
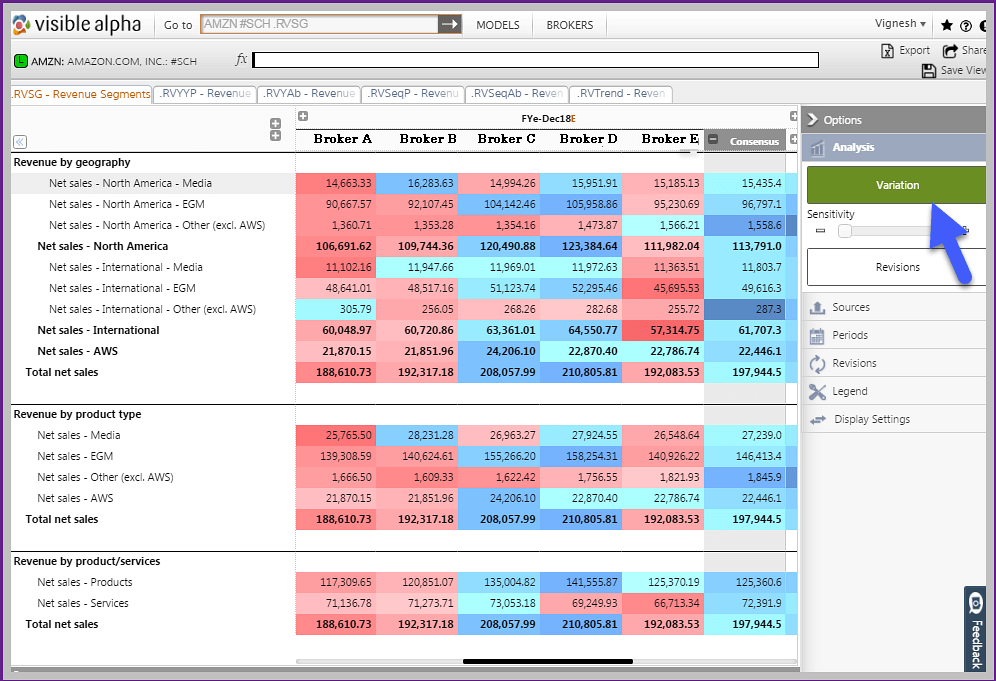
Visible Alpha is one such tool. Instead of poring through various analyst models, one could use the variation visualization tool within Visible Alpha to identify who is bullish and bearish on a company. Then, with one-click, you can explore segment and product margins, comp tables and usage metrics to identify the most important drivers.

For illustrative purposes only.
From before earnings are reported to after, Visible Alpha makes earnings season less about model requests and compiling consensus estimates and more about analyzing the key takeaways from every earnings report.
For deeper insight into company fundamentals ahead of earnings season, request a trial of Visible Alpha today.
Vignesh Murali is a Product Specialist at Visible Alpha. Before Visible Alpha, Vignesh covered P&C Insurance at Sterne Agee CRT and Software at Sidoti & Company. Vignesh has a Masters in Finance from the University of Illinois at Urbana-Champaign, and has also worked with the Financial Times as an Event-Driven Research Analyst.


