What are investors really trying to figure out ahead of a company’s earnings report?
We can think of it from two perspectives: 1) Where are investor expectations for the company, and 2) Where are my own views? Using these two perspectives, investors are able to take appropriate action on a company ahead of its earnings announcement. In this post, we’ll highlight how Visible Alpha can help investors achieve these goals.
What are investor expectations?
Getting a sense for where overall investor expectations are helps frame your own view and inform you of how different (or similar) your view is from the street. It can also be used to help understand how to judge company performance by providing a benchmark.
Access Detailed Company Consensus Metrics
One of the simplest ways to get a sense for investor expectations is to see what the consensus is for key company metrics. Visible Alpha provides preview tearsheets that offer a quick view of much of the consensus data on our platform (from regular line items such as revenue and adjusted operating income to detailed line items such as Google Sites Revenue excluding FX) and where the expectations are for the next quarter and year.
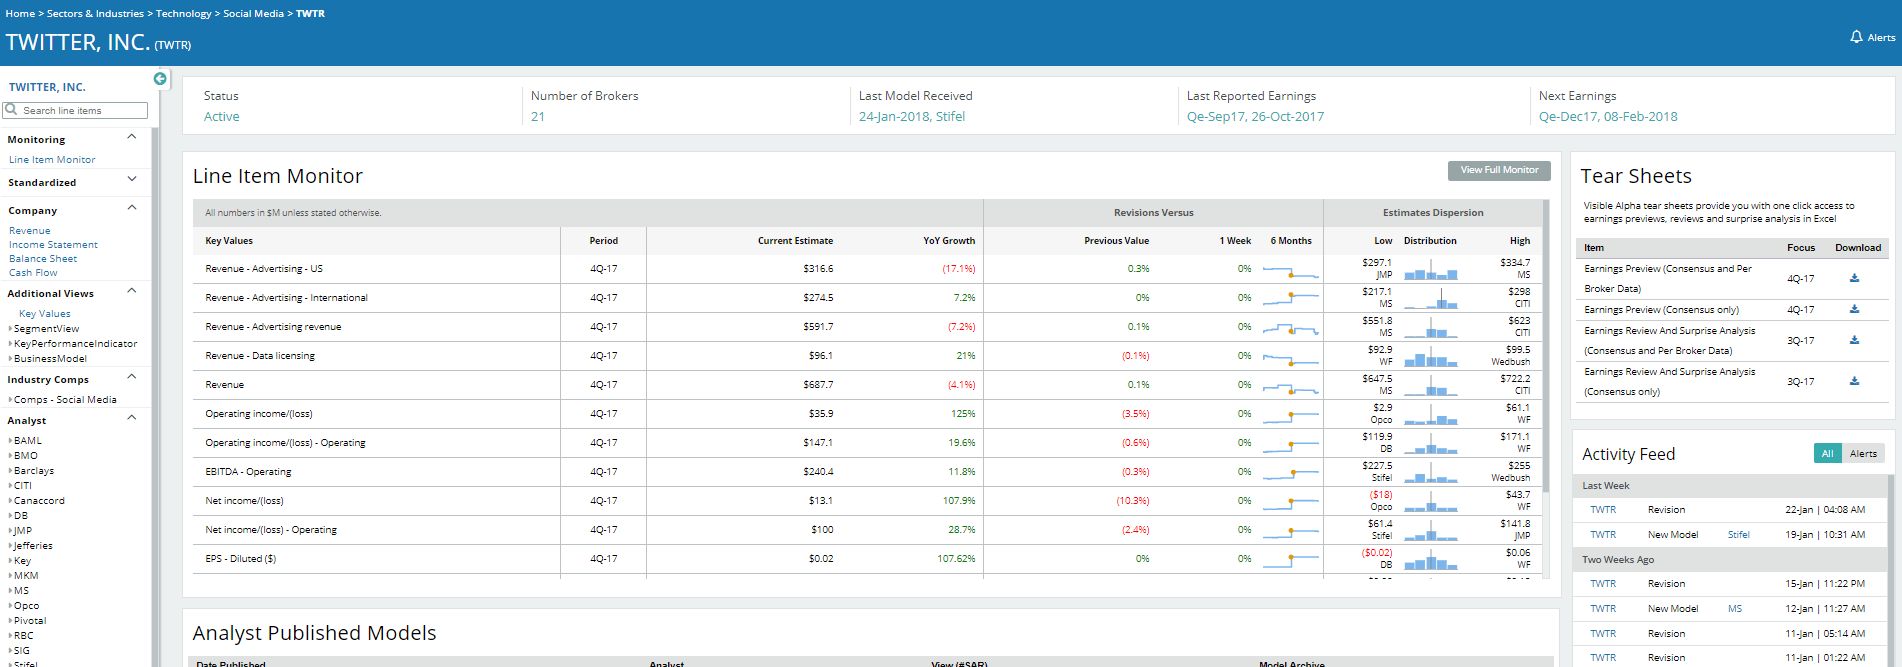
Source: Visible Alpha as of January 31, 2018. For illustrative purposes only.
You can download the spreadsheets on the company main page on the right, and select either consensus and broker-specific data (based on your entitlements). Additionally, you can input actuals immediately after the earnings report comes out to fuel your analysis.
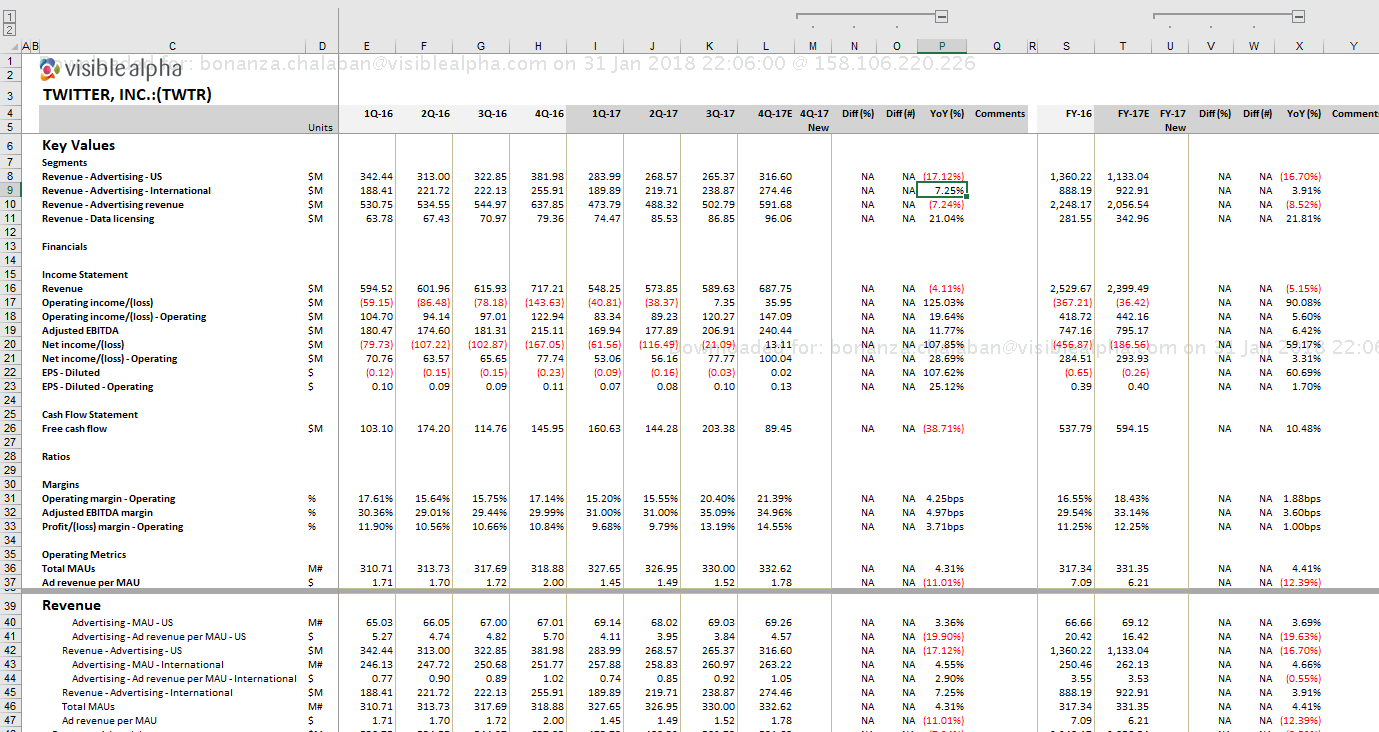
Source: Visible Alpha as of January 31, 2018. For illustrative purposes only.
Perform Company Analysis and Data Visualization
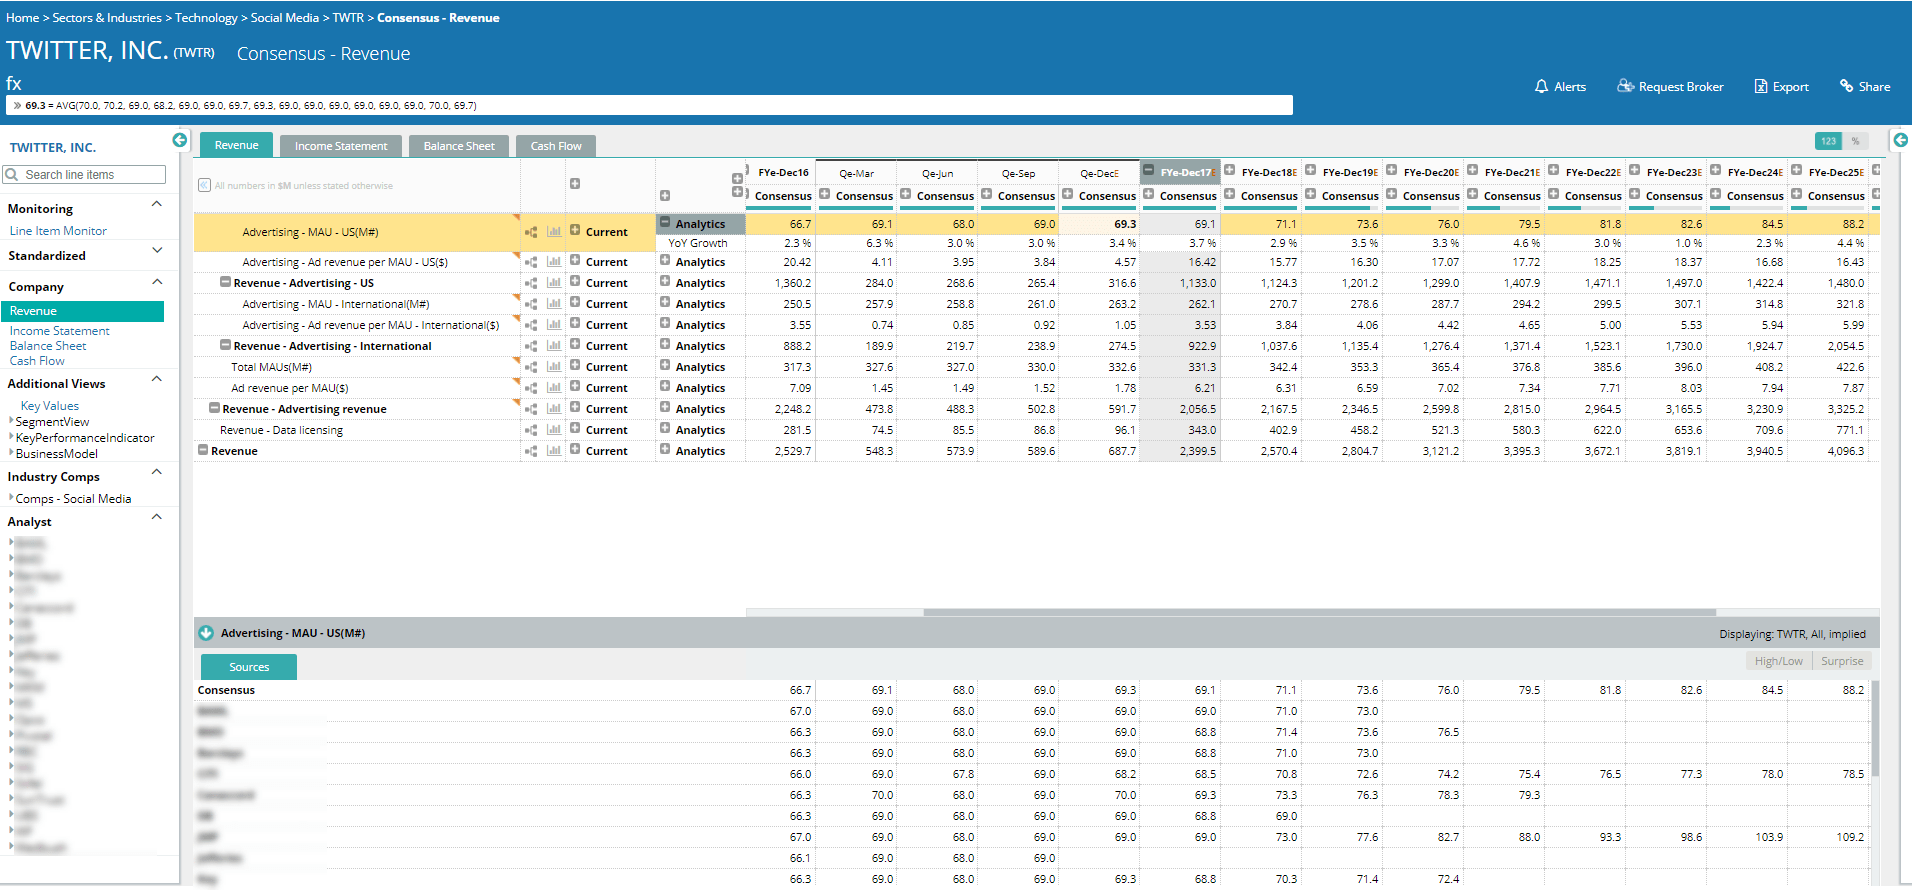
Additionally, investors can look at this data on the Visible Alpha Insights platform, which offers a variety of analytic overlays and data visualization tools.
 Source: Visible Alpha as of January 31, 2018. For illustrative purposes only.
Investors are often used to analyzing metrics from a year-over-year growth rate perspective, and this view can be toggled on within our platform from the right-hand toolbar under Analytics, and then displayed using the button next to the line item.
Uncover Shifts in Investor Expectations
Finally, investors can also get a sense for how investor expectations have changed throughout the quarter and year as analysts update their models and more data points are revealed.
Historical estimates can be shown on the platform in multiple ways, but perhaps the fastest way is by looking at the revision chart.
Source: Visible Alpha as of January 31, 2018. For illustrative purposes only.
Right click on the desired data point and click on “Revision charts” to see this view. The chart can also be seen over a two year period by changing the duration under “Type” at the top right.
Formulating Your Own Views
Investors spend a significant amount of time developing their own views on the company and their upcoming quarter through channel checks, discussions with management, and discussions with other sell-side analysts. The investor’s goal is to not just unearth new data points, but to also hear new perspectives and arguments that they may not have considered.
Visible Alpha helps you find the right people to speak to by quickly showing broker estimates (based on your entitlements) and the most bullish and bearish analysts. There are several ways to look at broker-specific estimates. You can either:
(1) right click on the desired number and click on “Distribution charts”
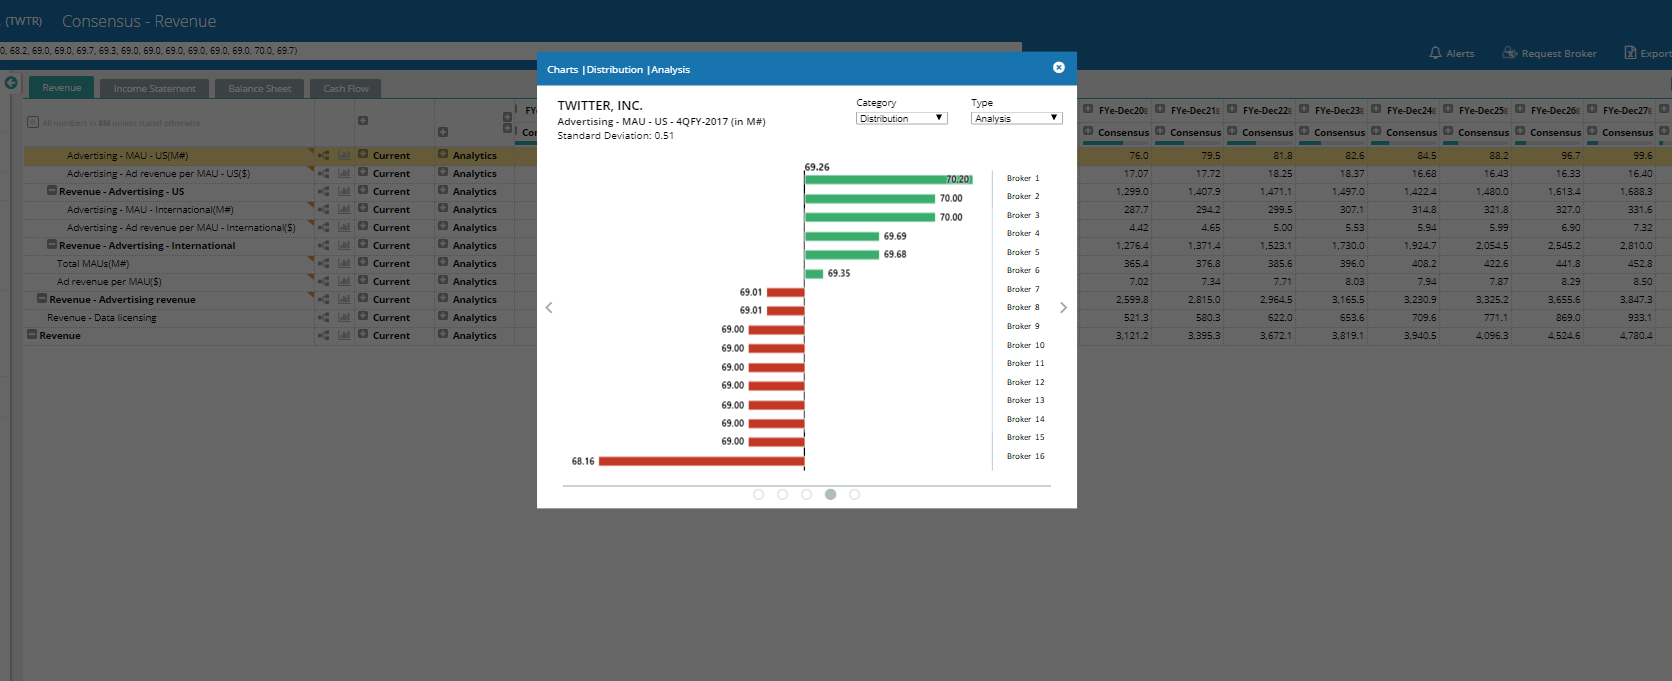
Source: Visible Alpha as of January 31, 2018. For illustrative purposes only.
(2) expand the Consensus column at the top of the table
Source: Visible Alpha as of January 31, 2018. For illustrative purposes only.
(3) click on the desired number and press “i” to toggle the Inspector tool
Source: Visible Alpha as of January 31, 2018. For illustrative purposes only.


