It’s the most magical time of the year…especially for this retailer

With Black Friday and Cyber Monday behind us, the 2017 holiday season is in full swing. For retailers, this is a crucial period as quarterly sales during this time are generally a disproportionate amount of their total sales for the full year.
How have consumer sales fared so far? According to the National Retail Federation, more than 174 million consumers shopped in-store or online between Thanksgiving and Cyber Monday, representing over 6% growth. According to Adobe Insights, the holiday shopping season from November 1st to November 27th has driven a total of $50 billion in sales so far, representing a 16.8% increase year-over-year.
Using data from the Visible Alpha platform, we can to look at expectations for several of the largest national retailers at the company level.
Total Sales Growth
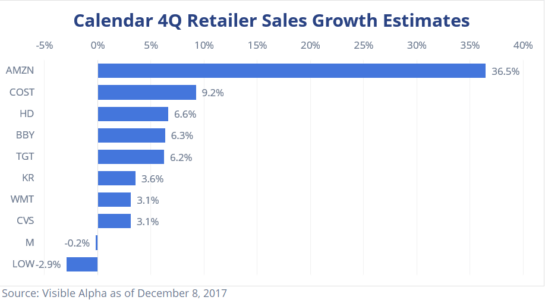
Looking at the total sales growth among the largest retailers, we can immediately acknowledge Amazon (AMZN) is growing at an extremely high rate compared to other retailers. Their sales growth is estimated at 36.5% while the other retailers, who have large brick-and-mortar presences, are estimated at roughly 3-6% sales growth for 4Q. While the majority of these retailers are growing at a steady rate, Macy’s (M) and Lowe’s (LOW) both have declining growth rates.
More Specifically…
Most consensus providers will have sales growth available to analyze; however, retailers often provide more specific metrics that exclude growth impacts from new stores, FX effects, gas price changes and other adjustments. Given that Visible Alpha is able to mine estimates directly from sell-side models, we can compare the consensus estimates for these metrics to get a better view of the underlying retailer growth. One caveat to note is that these metrics will not be perfectly comparable due to differences in methodologies. However, this alternate view does attempt to give a better sense of the underlying trends.
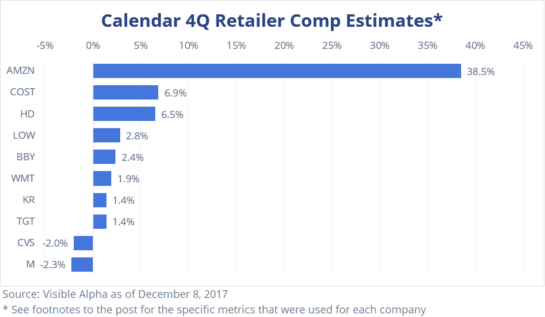
After excluding growth from new stores and other effects, we can see Amazon’s (AMZN) dominance remains intact and retailer growth in general is several points lower. Additionally, the order of the retailers shifts. Lowe’s (LOW) makes the biggest jump and Target (TGT) falling the furthest. Finally, the retailers with the highest underlying growth also tend to have the best stock performance over the last year.
Going forward, it will be interesting to see how these estimates move as we get deeper into the holiday season.
Go beyond consensus with Visible Alpha.
Note: For each company, we use the closest metric available that look at comparable sales. The metrics are:
AMZN: North America Retail Sales Growth
WMT: US Comparable Sales Growth
TGT: Comparable Sales Growth
COST: US Comparable Sales Growth excluding impacts from gas price changes and foreign exchange
KR: Identical Supermarket Sales Growth, without Fuel
M: Comparable Sales Growth, Excluding Licensing
CVS: Same Store Sales
HD: Comparable Store Sales
LOW: Comparable Sales
BBY: Domestic Comparable Sales


