West Texas Intermediate refers to prices of NYMEX traded futures contracts for high-quality crude oil (light and sweet) and stored in Cushing, Oklahoma for delivery. It is used as a key benchmark for U.S. and global crude oil markets.
Upstream Oil & Gas Industry Introduction
The oil and gas exploration & production (E&P) industry, also known as the upstream industry, is the first of three segments in the energy sector value chain. Upstream activities include exploring basins for hydrocarbons, drilling and developing wells and extracting hydrocarbons such as crude oil, natural gas and natural gas liquids (NGLs) from those wells. The extraction of oil is resource-intensive and can often take several years from discovery to production.
Once the hydrocarbons are extracted they are stored and transported to processing plants where the raw hydrocarbons are converted into consumable products like gasoline, diesel, jet fuel and plastic, among others. In the final stage, these products are distributed to customers around the world.
Companies may participate in one or more stages of the value chain and are generally called “integrated” players.
This guide focuses on the upstream oil & gas segment of the energy sector value chain.

HYDROCARBON BASICS
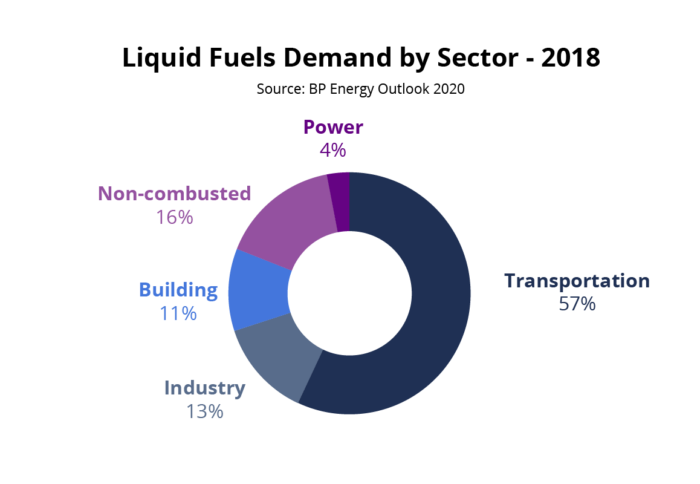
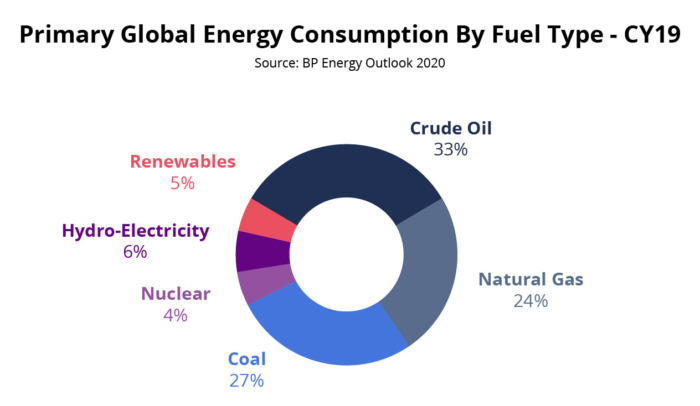
A hydrocarbon is an organic compound composed of hydrogen and carbon atoms. Hydrocarbon deposits are formed thousands of feet below the surface of the earth from the decomposition of organic material like plants and animals that died millions of years ago. Hydrocarbons are highly combustible and therefore mainly used as a source of fuel. Based on the “BP Statistical Review of World Energy 2020” report, hydrocarbons account for more than half of global primary energy consumption in 2019 (see chart below).
Types of Hydrocarbons
There are three primary forms of hydrocarbons that link to the upstream industry:
- Crude Oil (liquid form)
- Natural Gas (gas form)
- Natural Gas Liquids, or NGLs (semi-liquid form)
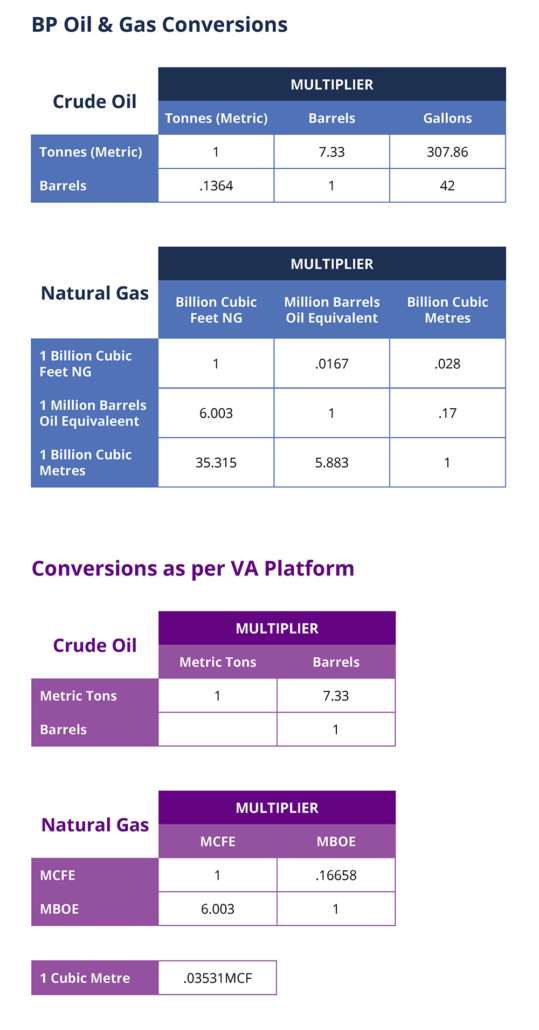
Crude oil and natural gas liquids are measured in barrels (one barrel = 42 gallons), while natural gas is reported in either cubic feet or cubic meters (one barrel of oil is equivalent to 6.003 thousand cubic feet (mcf) of natural gas).
Crude Oil
Crude oil is classified into various grades based on physical properties that vary widely depending on the geological condition of the deposit. API gravity – a measure of density relative to water – and the level of sulfur content are some of the most commonly used properties in classifying crude oil.
API gravity is a measure of density relative to water. API gravity is higher when density is lower. Based on API gravity, crude oil is classified into:
- Light Crude Oil: Crude oil with lower impurities, higher hydrogen and lower carbon content (high API gravity). These characteristics allow crude oil to flow freely at room temperature and are easy to process at refineries. Given the lower complexity in processing and higher output of high-demand products such as gasoline and diesel, it is generally priced at a premium to heavy crude oil.
- Heavy Crude Oil: A higher proportion of carbon and impurities and lower hydrogen content makes this category of crude oil highly dense (low API gravity). Because of these properties, it is more difficult to extract, transport and process, and generally priced at a discount to light crude oil.
Based on the level of sulfur content, crude oil can also be classified into:
- Sour Crude Oil: Crude oil with 0.5% and above sulfur content. Higher sulfur content causes a larger environmental impact and has a more corrosive effect on equipment. Sour crude oil is more expensive to process and trades at a discount to sweet crude oil.
- Sweet Crude Oil: Crude oil with less than 0.5% sulfur content.
Light and sweet crude oil (e.g., West Texas Intermediate) is the most preferred crude oil for processing and refining.
Natural Gas
Natural gas is generally classified into:
- Dry Natural Gas: Contains more than 85% methane and does not contain any other liquid gases. Higher methane content makes the gas drier.
- Wet Natural Gas: Wet gas contains less than 85% methane and also includes other liquid natural gases such as ethane, propane and butane. These additional liquids make the gas wet, requiring it to be separated before the gas can be used for final consumption.
OIL AND GAS INDUSTRY LIFE CYCLE
The upstream oil and gas industry life cycle can be classified into the following three stages:
1. Oil Exploration Stage
This stage involves the study of existing geological data to confirm the presence of hydrocarbon deposits. Once the presence of hydrocarbons is confirmed, companies obtain rights by leasing or outright purchasing the property and conduct various studies – such as gravity, magnetic and seismic wave surveys, or drilling appraisal wells – to confirm the presence of hydrocarbon deposits. If economically recoverable with existing technology, these fields move to the next stage.
The size of deposits (popularly known as “reserves”) is the total volume of hydrocarbons available in the deposit that are economically extractable. Depending upon the daily production run rate, these reserves may last from a few years to many decades. Given the finite life of these reserves, companies need to keep investing in exploration activity to maintain and grow production levels and reserves.
Deposits can be classified into onshore versus offshore based on location. Alternatively, deposits are classified as conventional or traditional versus unconventional or shale based on geological conditions.
Reserves are also classified into three categories: proven (or proved), probable and possible. Each category includes a different probability of recovery.
- 1P reserves refer to proven
- 2P is proven and probable
- 3P is proven, probable and possible reserves
2. Oil Development Stage
This stage begins after the company decides to invest capital in any viable field and involves designing and building the necessary infrastructure to produce commercial quantities of hydrocarbons.
3. Oil Production Stage
In the final stage, hydrocarbons are extracted to the surface. Generally, the initial production run rate, which is usually measured by average daily production, tends to be higher. However, as well pressure drops the production volume also declines. Decline rates are much faster for unconventional (shale) deposits compared to conventional deposits. Companies use a variety of enhancement techniques to slow the decline rate, including pumping water through secondary wells that could be drilled in a field. Hydrocarbons underground are generally mixed with water, sand and salt and separated at the gathering centers. Once all the economic hydrocarbons are extracted, the wells are decommissioned (i.e. capped), and the field is abandoned after restoration to as close to its original state as possible.
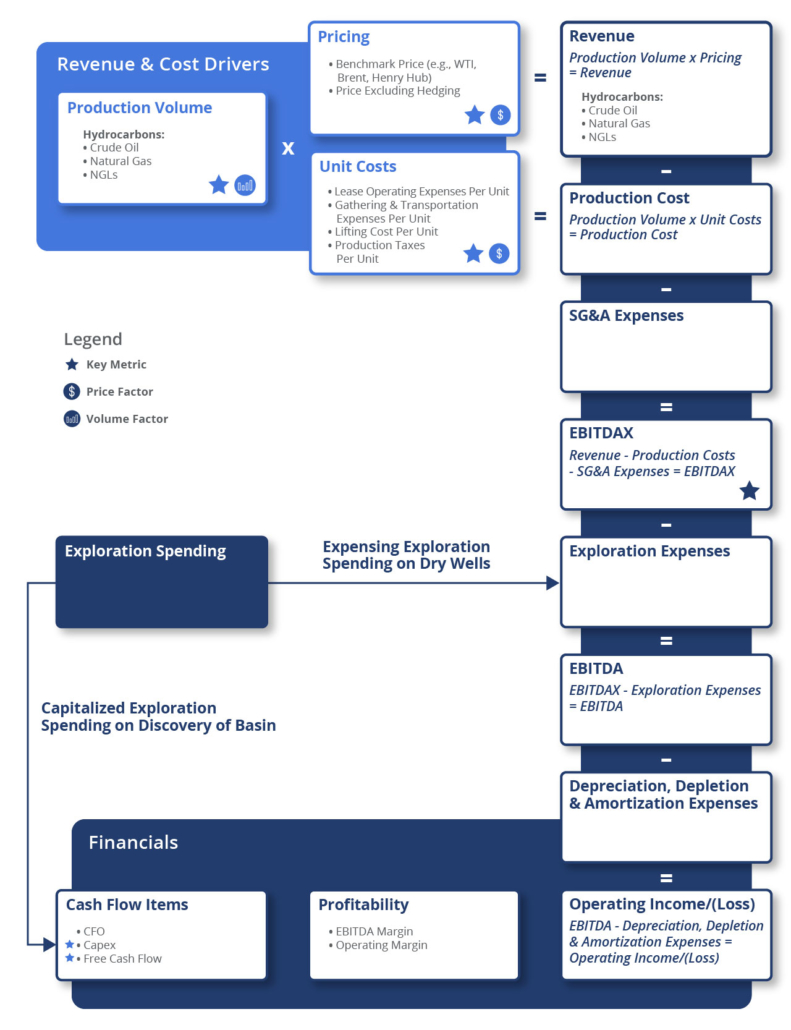
Key performance indicators (KPIs) are the most important business metrics for a particular industry. When understanding market expectations for oil and gas exploration & production, whether at a company or industry level, here are some of the E&P KPIs to consider.
Visible Alpha’s Standardized Industry Metrics
To understand market expectations for the oil and gas exploration & production industry, a key information source is sell-side analyst estimate and consensus forecast data. The buy side, sell side and public companies leverage this type of data to conduct competitive analysis, a type of analysis conducted by professional analysts that involves comparing standardized metrics of one company with those of similar companies. Because companies report metrics differently – and sometimes report on different metrics altogether – standardizing the key metrics for each company can be a cumbersome process.
Visible Alpha Insights includes analyst data, company data and industry data at level of granularity unparalleled in the market. Our industry data – Standardized Industry Metrics – enables market participants to quantify and compare market expectations for companies across 150+ industries.
Data as of January 2023
Industry KPI Terms & Definitions
Visible Alpha offers an innovative, integrated experience through real-time, granular consensus estimates and historical data created directly from the world’s leading equity analysts. Using a subset of the below KPIs, this data can help investors hone in on the key drivers of companies to uncover investment opportunities. Learn More >
West Texas Intermediate (WTI)
West Texas Intermediate refers to prices of NYMEX traded futures contracts for high-quality crude oil (light and sweet) and stored in Cushing, Oklahoma for delivery. It is used as a key benchmark for U.S. and global crude oil markets.
Brent Prices
Brent prices refer to the prices of crude oil future contracts traded in the Intercontinental Exchange (ICE). It is based on light and sweet crude oil produced in the North Sea region of Northwest Europe.
Henry Hub Prices
Henry Hub pipeline located in Erath, Louisiana, acts as a delivery point for NYMEX traded futures contracts for natural gas. It is a benchmark for the entire North American natural gas market.
Barrels of Oil Equivalent (BOE)
Barrels of oil equivalent is the approximate energy released from burning a barrel of oil. This unit measure helps in converting natural gas and crude oil into one single unit.
Natural Gas Equivalent (Cfe)
Natural gas equivalent is the approximate energy released from burning natural gas. This unit measure helps in converting natural gas and crude oil into one single unit. One MCF (one thousand cubic feet) of natural gas has one-sixth the energy of a barrel of oil.
Hedging
Hedging is the use of derivative instruments to reduce volatility in market prices (price risk) and protect the company’s earnings.
Price Excluding Hedging
Price excluding hedging is the average realized prices from selling hydrocarbons before hedging impact.
Production Volume Per Day
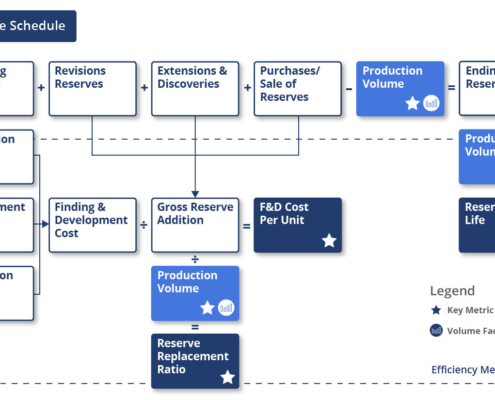
Production volume per day is the daily production run rate for a given period for each of the hydrocarbons and at the total level using either a BOE or cfe basis.
Production Volume
Production volume is the total hydrocarbons output from producing wells for a given period of time.
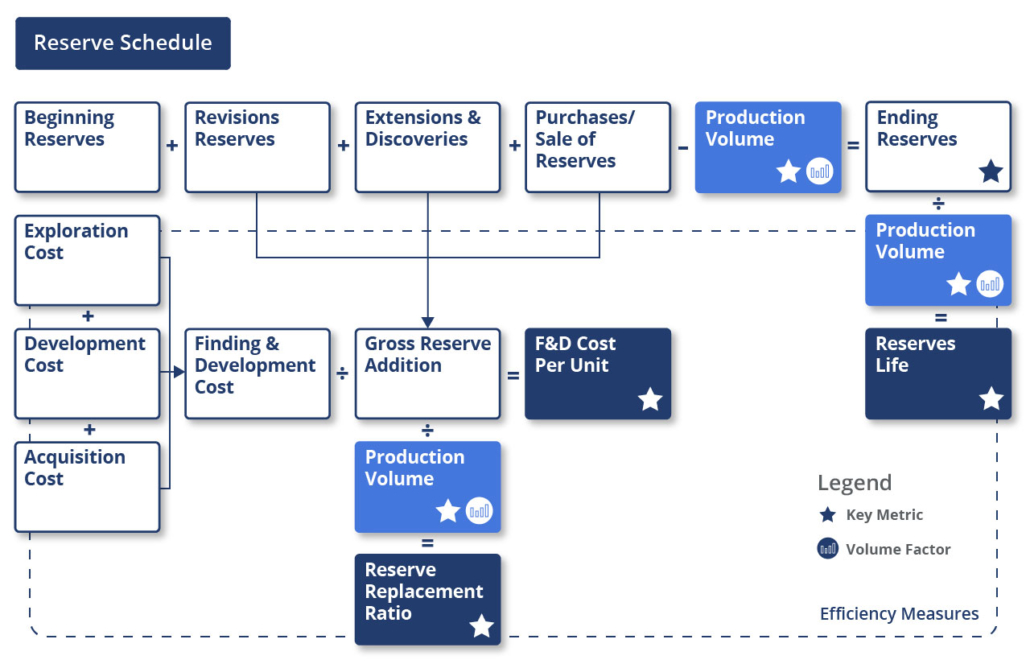
Reserve Replacement Ratio
Reserve replacement ratio (RRR) is calculated by dividing the net proved reserves added through discoveries, revisions and net acquisitions for a given period by the total production volume for the same period.
Total Revenue – Oil, Natural Gas Liquids and Natural Gas
Total revenue for all hydrocarbons such as crude oil, natural gas liquids (NGLs) and natural gas, excluding the effect of hedging.
Lifting Cost
Lifting costs are direct costs relating to the operation and maintenance of hydrocarbon producing equipment (such as rigs) and labor.
Lifting Costs Per Unit
Lifting costs on a per unit basis, calculated by dividing lifting costs by total production.
Rent and Lease Expense
Recurring costs associated with an active well and its associated equipment. These costs can include rent, insurance and payroll.
Lease Operating Expense Per Unit
Rent and lease expense on a per unit basis. Computed by dividing rent and lease expense with total production.
Gathering and Transportation Expenses
The costs related to the movement of raw oil or gas, such as transportation, marketing and processing of crude oil, natural gas and refined petroleum products.
Gathering and Transportation Costs Per Unit
Gathering and transportation expenses on a per unit basis. Computed by dividing gathering and transportation expenses by total production.
Taxes Other Than Income Taxes
Taxes paid for the production of hydrocarbons, such as royalties and other indirect taxes.
Production Taxes Per Unit
Taxes other than income taxes on a per unit basis. They are computed by dividing taxes and other than income taxes by total production.
Production Costs
The production costs that are incurred in the operation and maintenance of wells/facilities and depletion. A combination of rent and lease operating expenses, taxes and other than income taxes, and gathering and transportation costs. Rent and lease expenses together with gathering and transportation costs form lifting costs.
Production Costs Per Unit
Production cost on a per unit basis. Calculated by dividing production costs by total production. This measure illustrates how efficiently the producer is extracting hydrocarbons.
Exploration Expense
Exploration expenses relating to searching for new hydrocarbon deposits, as well as the cost of drilling dry wells.
Exploration Expense Per Unit
Exploration expenses on a per unit basis. Computed by dividing exploration expenses with total production.
Upstream Production Costs
Production cost relating to the upstream segment of integrated oil and gas companies.
Upstream Production Cost Per Unit
The per unit production cost for the upstream segment of integrated oil and gas companies.
Ending Reserves
Ending reserves are the proved developed reserves that can be expected to be recovered through existing wells and facilities and by existing operating methods.
API Gravity
The American Petroleum Institute metric used for measuring the weight of petroleum products compared to water. API gravity is inverse to density – the higher the API gravity, the lower the density of the petroleum product.
Standardized Measures
Standardized measures are a set of non-GAAP supplemental financial data reported by U.S. E&P companies as per SEC regulations. They include standardized measures of discounted future cash flows from the production of proved reserves and help investors to make comparisons between companies.
OPEC Countries
OPEC countries are Saudi Arabia, Iraq, UAE, Kuwait, Nigeria, Angola, Libya, Algeria, Venezuela, Congo, Equatorial Guinea and Gabon.
Reserve Life
Reserve life represents the estimated life in years of the reserves and is computed by dividing ending reserves by production volume.
Abbreviations
| bbl | Barrel |
|---|---|
| mbbl | 1000 barrels |
| mmbbl | 1 million barrels |
| boe | Barrels of oil equivalent |
| Bpd (bbl/d) | Barrels per day |
| 1P Reserves | Proven reserves |
| 2P Reserves | Sum of proven and probable reserves |
| 3P Reserves | Sum of proven, probable and possible reserves |
| mcf | 1000 cubic feet |
| mmcf | 1 million cubic feet |
| bcf | Billion cubic feet |
| bcm | Billion cubic metres |
| mcfe | Natural gas equivalent |
| F&D | Finding and development |
Unit Conversions
To convert units, use the multiplier in the charts below.
- Barrels of Oil Equivalent (BOE) = Gas Equivalent * 6.003
- Gas Equivalent (mcfe) = Oil Equivalent/6.003
Download this guide as an ebook today:
Guide to Upstream Oil & Gas KPIs for Investment Professionals
This guide highlights the key performance indicators for the upstream oil and gas industry and where investors should look to find an investment edge, including:
- Oil & Gas Industry Business Model & Diagram
- Key Upstream Oil & Gas Metrics PLUS Visible Alpha’s Standardized Industry Metrics
- Available Comp Tables
- Industry KPI Terms & Definitions

