- Beginning AUM
- Net New Flows
- Net Market Performance & Fx Impact
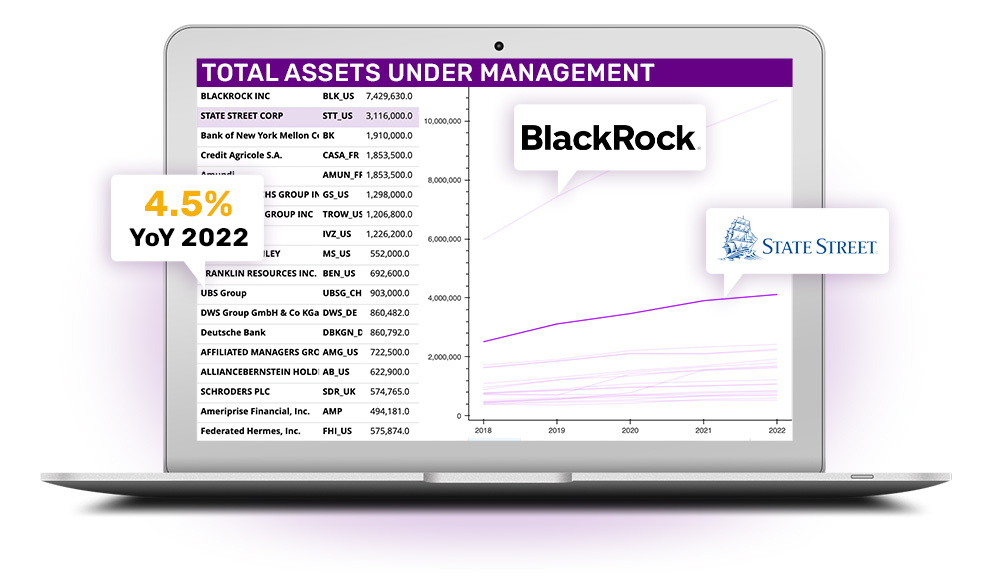
- Total Assets Under Management (AUM)
Key performance indicators (KPIs) are the most important business metrics for a particular industry. When understanding market expectations for Asset Management, whether at a company or industry level, some Asset Management KPIs to consider include:
Industry KPI Terms & Definitions
Visible Alpha offers an innovative, integrated experience through real-time, granular consensus estimates and historical data created directly from the world’s leading equity analysts. Using a subset of the below KPIs, this data can help investors hone in on the key drivers of companies to uncover investment opportunities. Learn More >
Management Fees
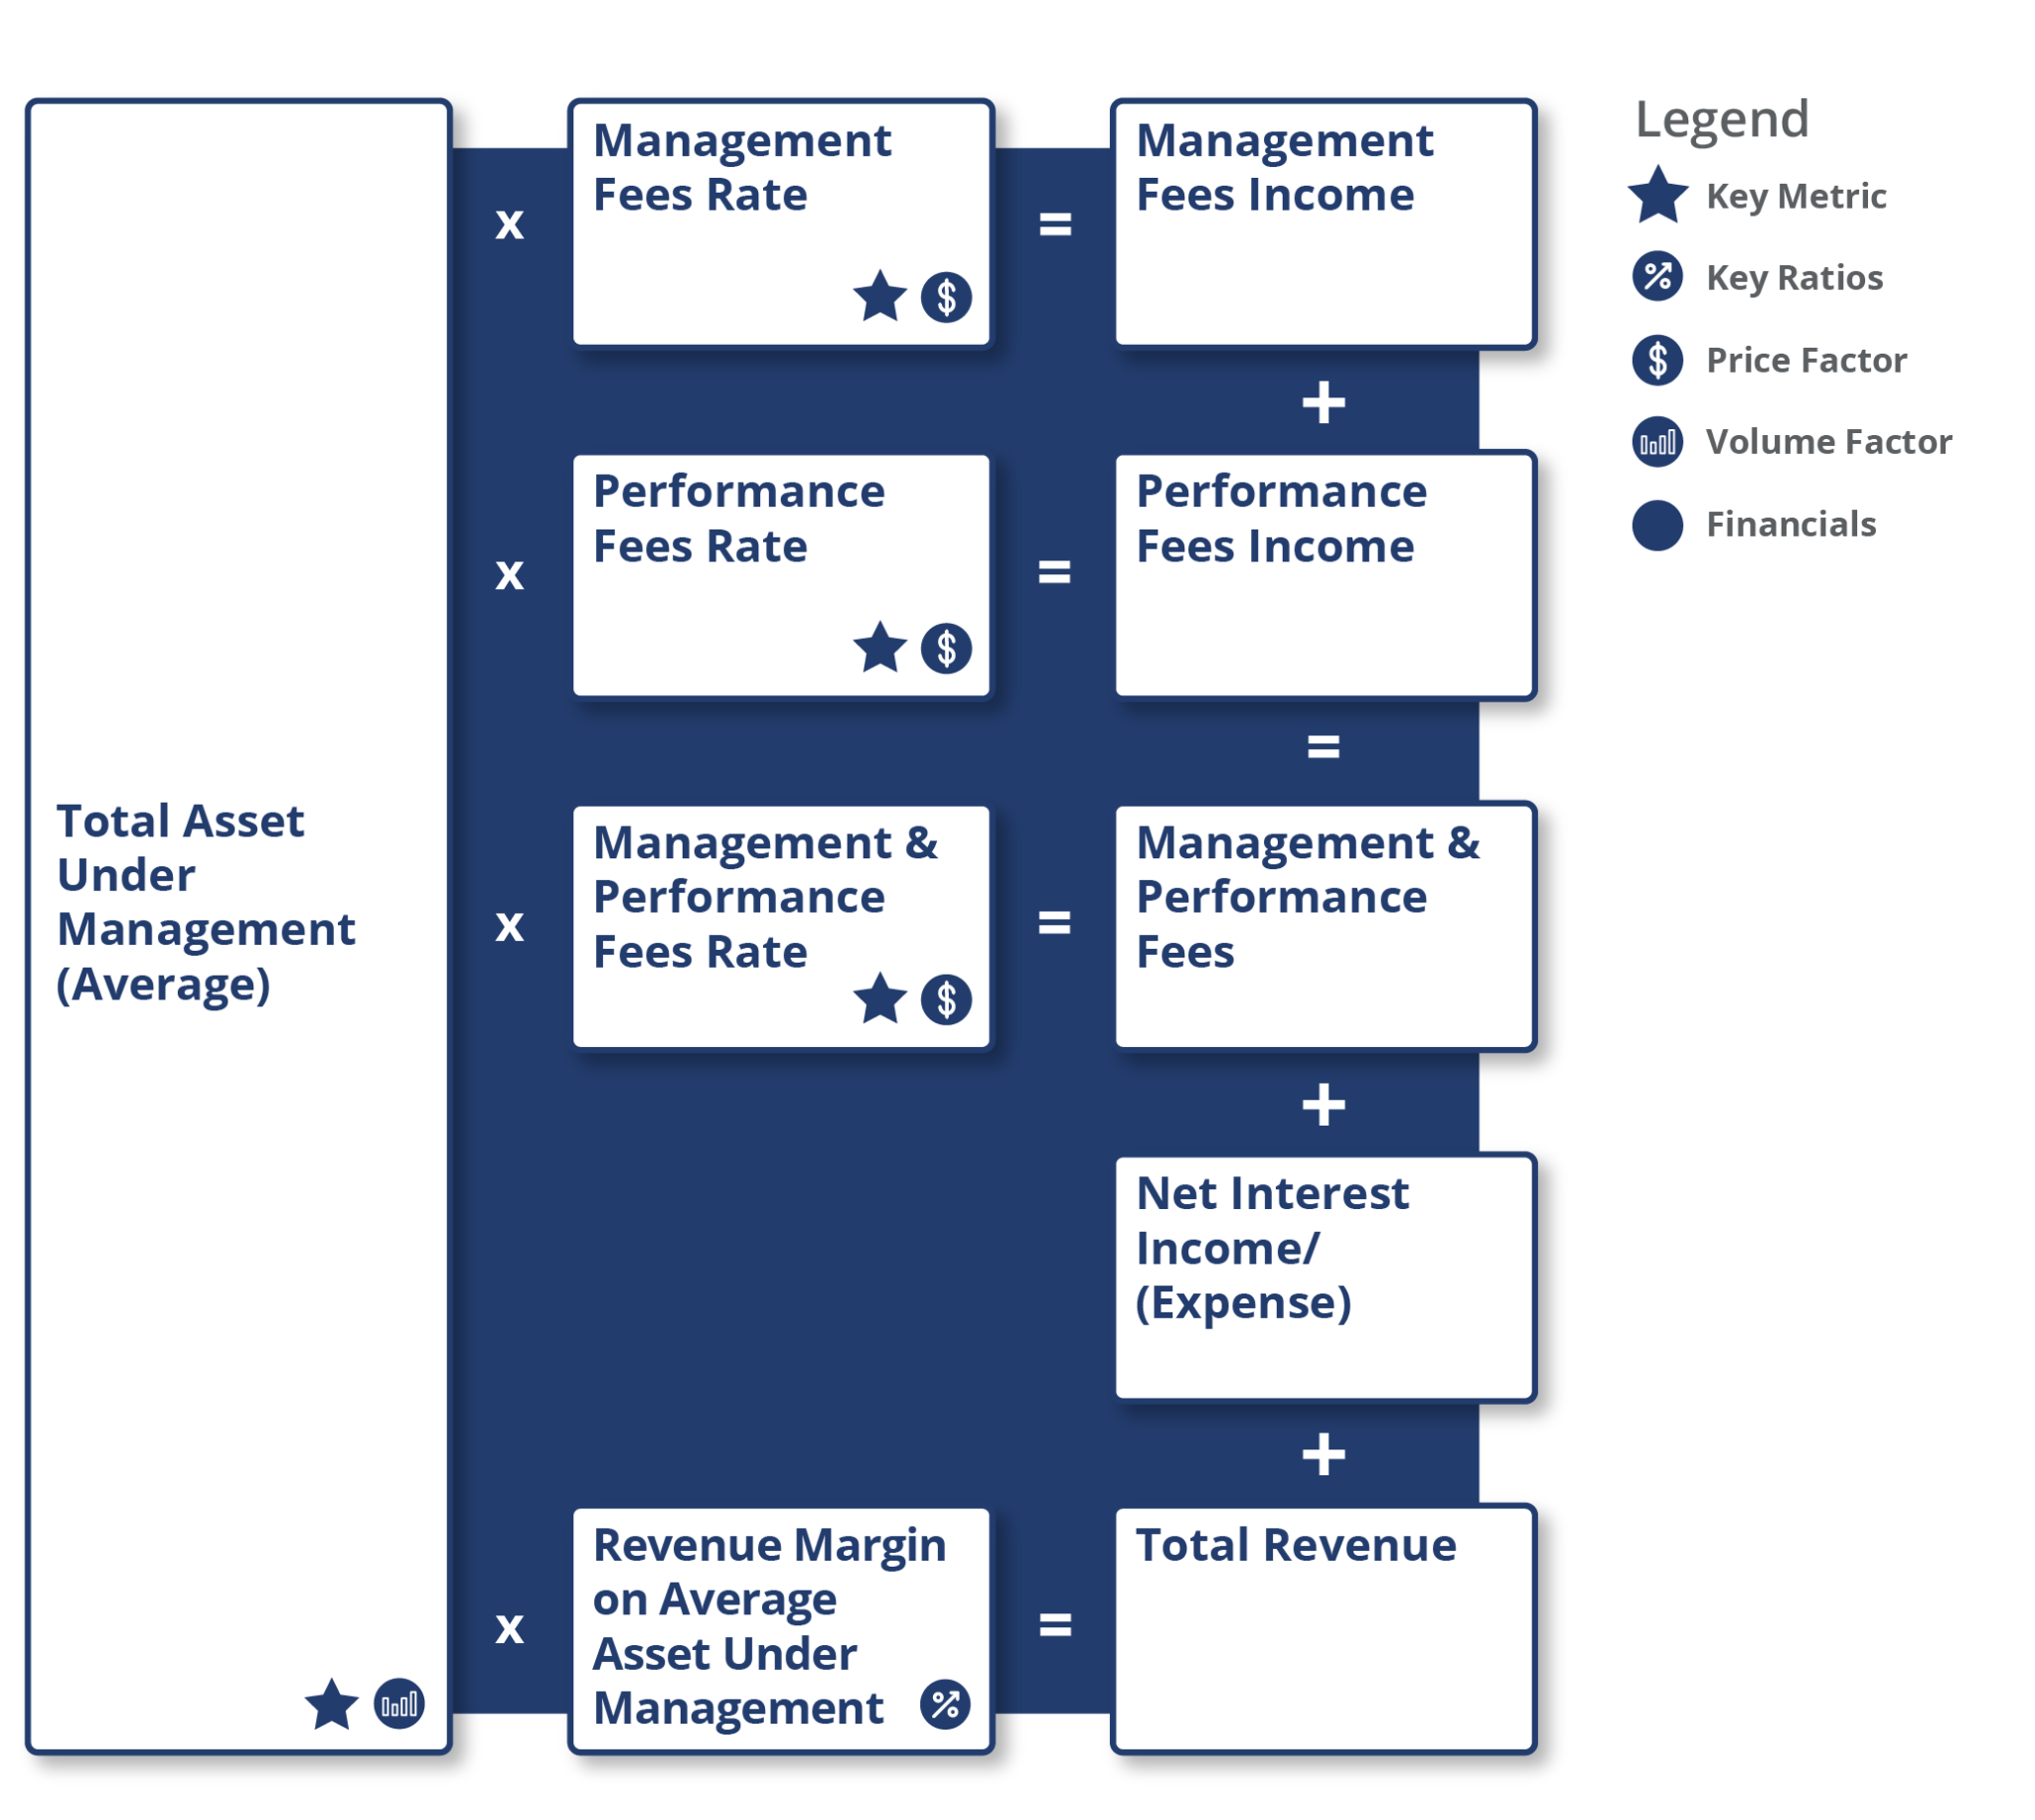
Management fees are charged as a percentage of assets under management (AUM) and are received by the asset manager on a monthly or quarterly basis.
Performance/Incentive Fees
Performance/incentive fees are received by an investment advisor depending on the fund’s performance in a given period, relative to various predetermined benchmarks.
Fee and Commissions Income
Fee and commissions income comprises management fees, performance fees, and other fees charged by asset management companies for the assets they manage on behalf of their clients.
Total Revenue
Total revenue includes fees charged by asset managers to manage the fund which includes Management and performance fees and distribution service fees for asset management companies.
Operating Income /(Loss)
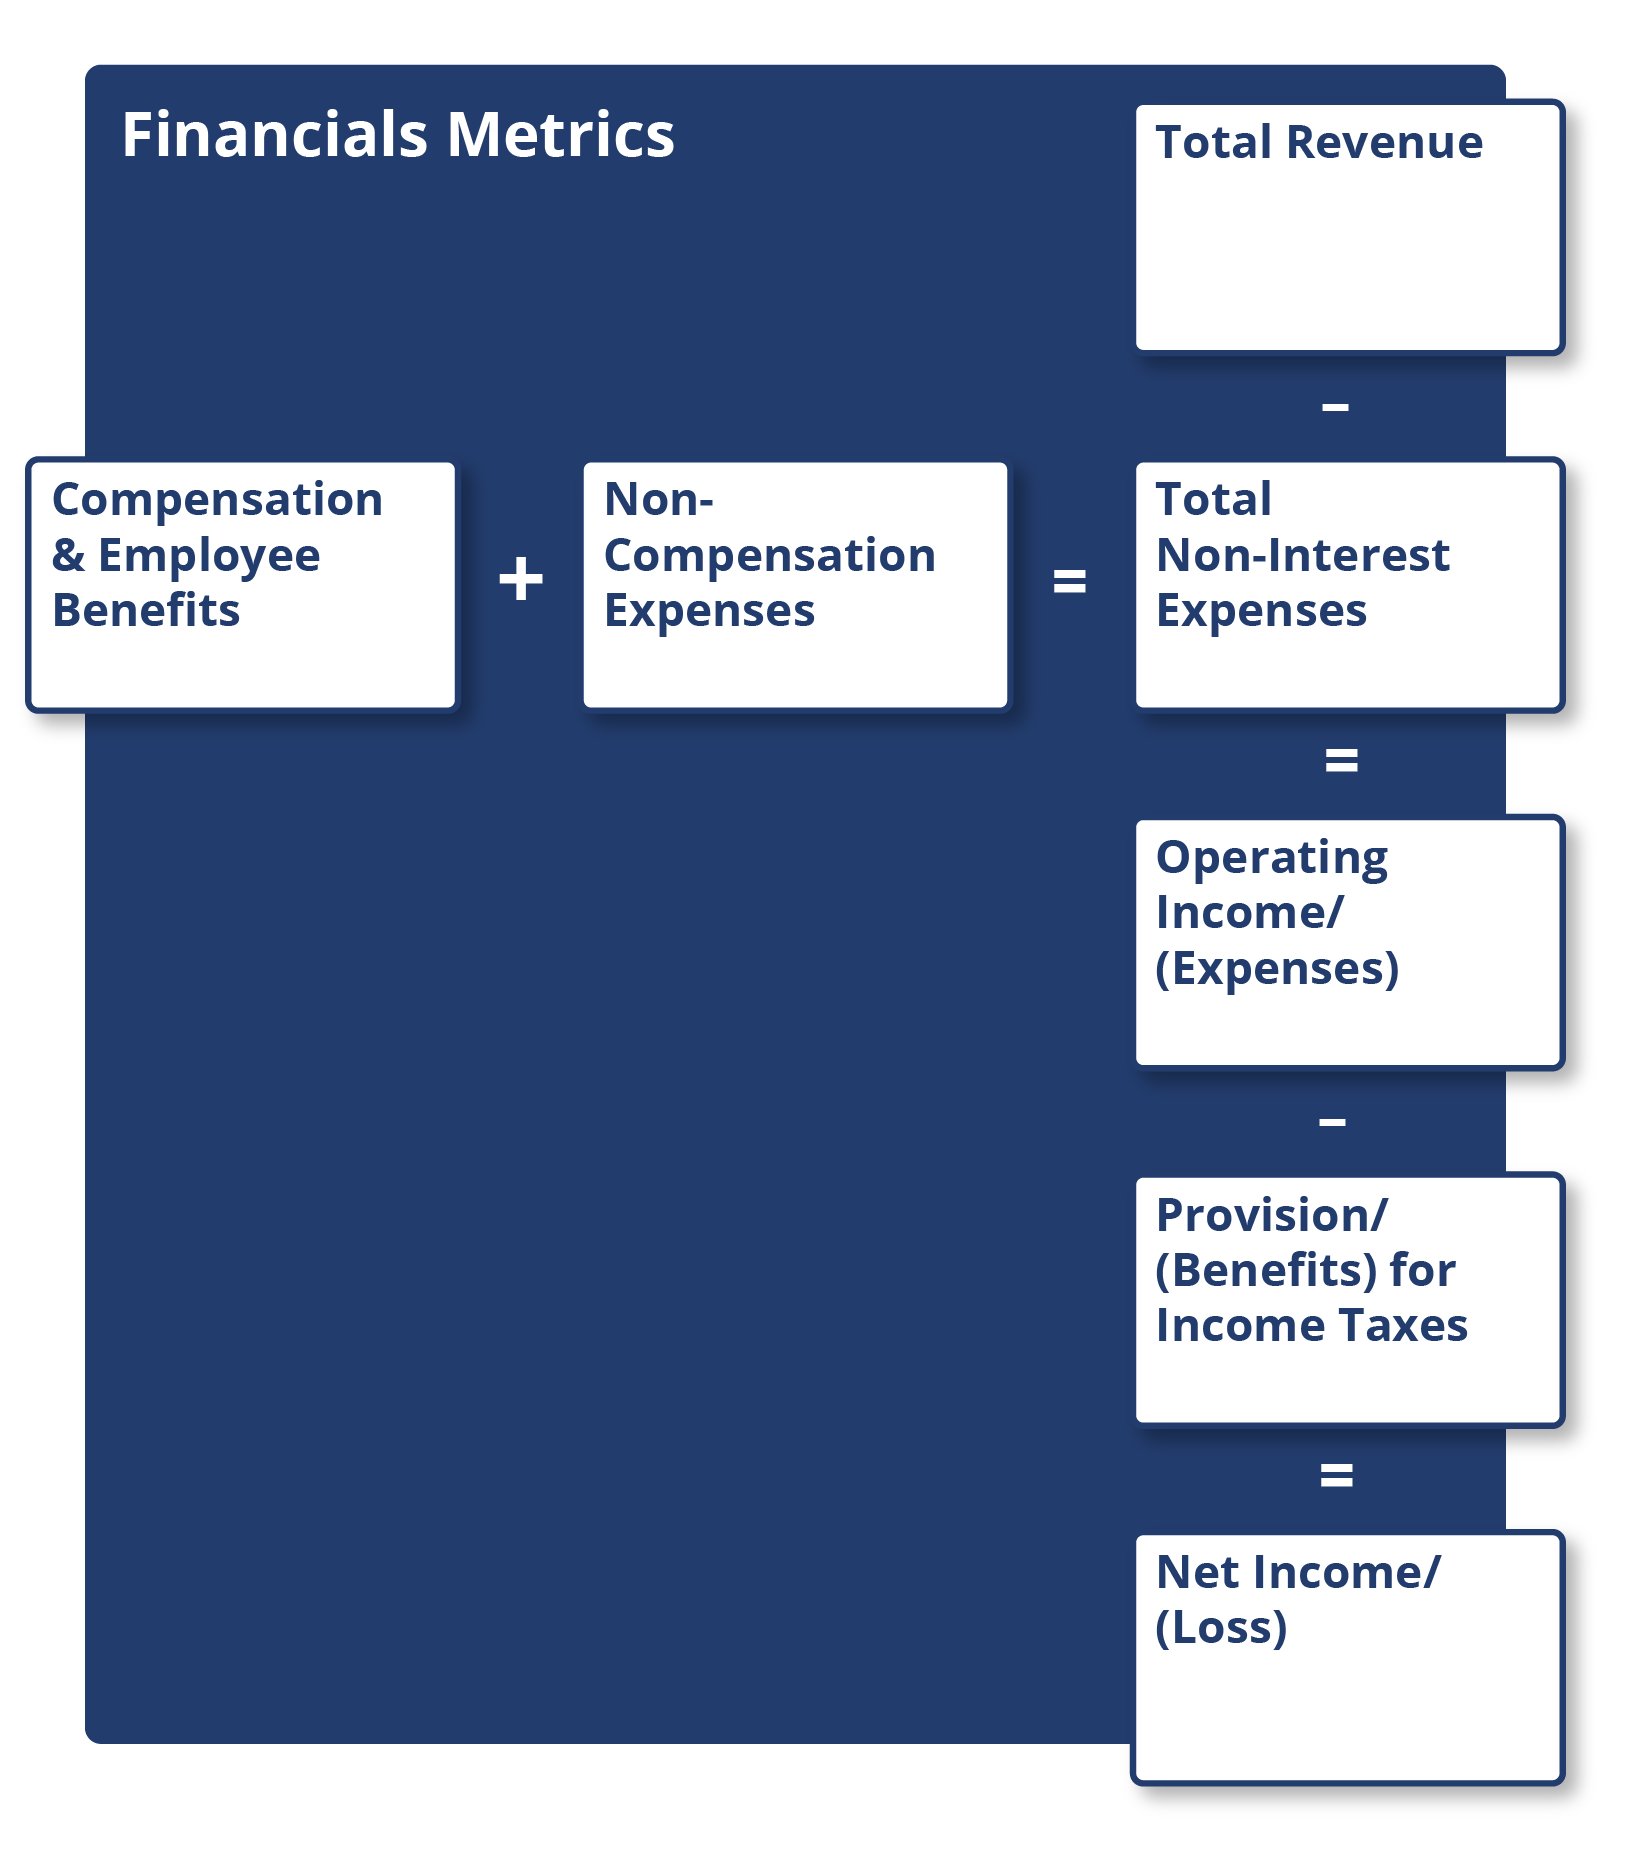
Operating income is the amount of profit generated from the operations of an asset management company, after deducting operating expenses such as compensation, distribution cost, and other general and administrative expenses.
Net Income Applicable To Common Stockholders
Net income applicable to common stockholders is the amount of revenue a company reports after tax and dividend payments are deducted from the total income earned.
Earnings Per Share (EPS)
Earnings per share (EPS) is computed by deducting preferred stock dividends from a company’s net income. Diluted EPS is a calculation used to understand the quality of a company’s EPS if all convertible securities were exercised.
Common Stock Dividends Per Share
Common stock dividends per share are the number of declared dividends issued by a company for every common share outstanding.
Total Stockholders Equity Including Minority Interest
Total stockholders equity including minority interest is the remaining amount of assets available to shareholders after all liabilities have been paid.
Efficiency Ratio
Efficiency ratio is a key measure of productivity and cost control. It is defined as non-interest expenses as a percentage of total revenue. Other terms used for the efficiency ratio are cost-to-income ratio and expense ratio.
Dividend Payout Ratio
Dividend payout ratio is dividends declared per common share as a percentage of diluted earnings per common share.
Total Payout Ratio
Total payout ratio is total common dividends declared plus common stock repurchases as a percentage of net income available to common shareholders.
Return On Average Assets
Return on average assets is net income applicable to common shareholders as a percentage of average assets. It shows the management’s ability to generate a return over the assets it controls.
Return On Average Equity
Return on average equity is net income applicable to common shareholders as a percentage of average common shareholders’ equity. It shows management’s ability to generate a return on shareholders’ equity. This ratio can be compared to peers and against the cost of equity capital to identify asset managers’ ability to create shareholder value.
Management Fee Rate
Management fee rate is calculated as annualized management fee income divided by average assets under management (AUM).
Performance Fee Rate
Performance fee rate is calculated as annualized performance fee income divided by average assets under management (AUM).
Net New Flows
Net flows represent assets acquired and withdrawn by a client within a specified period. Net flow is a major driver of change to assets under management (AUM).
Net Market Appreciation/(Depreciation)
Net market appreciation/(depreciation) reflects how the market fluctuations impact a fund’s assets. This indicator will rise when the asset generates positive returns and will fall when it generates a negative return.
Foreign Currency Translation
Foreign currency translation reflects the impact of translating foreign-denominated AUM into domestic currency for reporting purposes.
Net Market Performance & FX Impact
Net market performance & FX impact is the total of net market appreciation/(depreciation) and FX movements.
Average Assets Under Management (AUM)
Average Assets under management (AUM) is the average of the Total asset under management of an asset management company.
Beginning Assets Under Management (AUM)
Beginning AUM is the ending value of the total assets under management (AUM) in the previous period.
Total Assets Under Management (AUM)
Total Assets under management (AUM) is the sum of the market value for all of the investments managed by an asset management company.
AUM Organic Growth Rate
Assets under management (AUM) organic growth rate represents growth in the size of assets under management due to the addition of new client money and withdrawals. It is calculated as net new flows divided by beginning assets under management.
Download this guide as an ebook today:
Guide to Asset Management Industry KPIs for Investment Professionals
This guide highlights the key performance indicators for the asset management industry and where investors should look to find an investment edge, including:
- Asset Management Industry Business Model & Diagram
- Key Asset Management Metrics PLUS Visible Alpha’s Standardized Industry Metrics
- Available Comp Tables
- Industry KPI Terms & Definitions
Contact Us
For more information, or to request data, fill out this form.