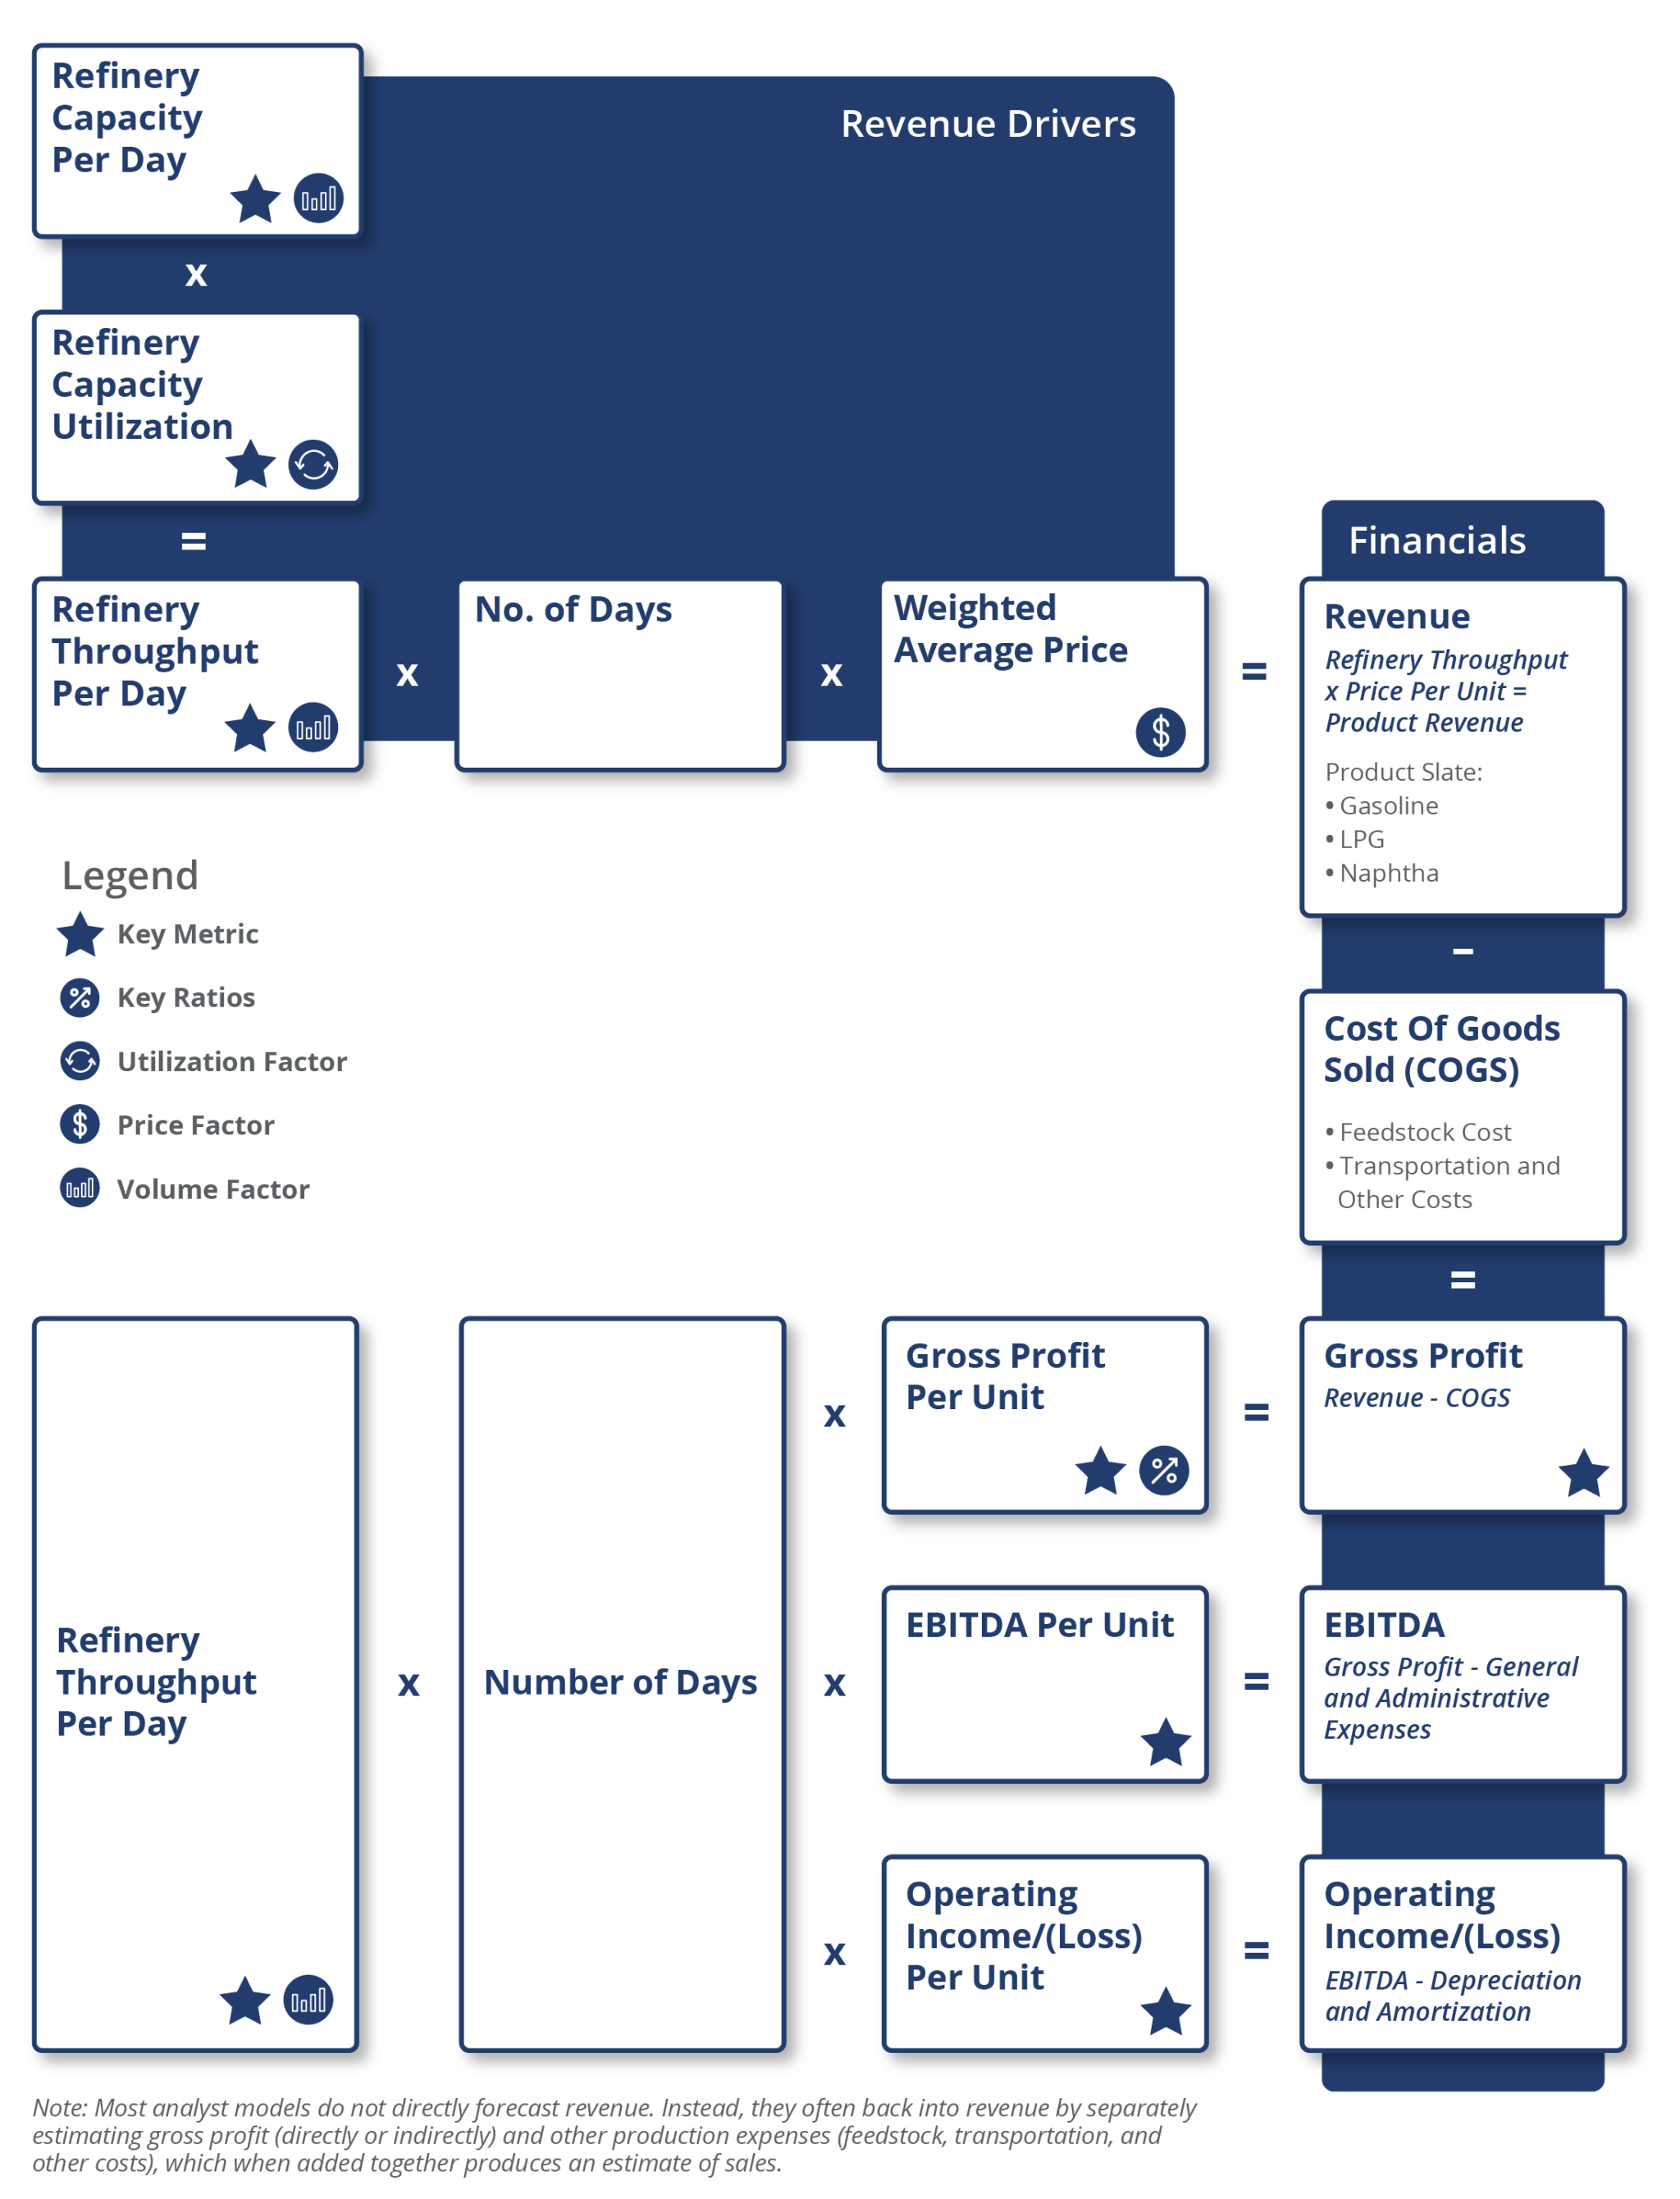
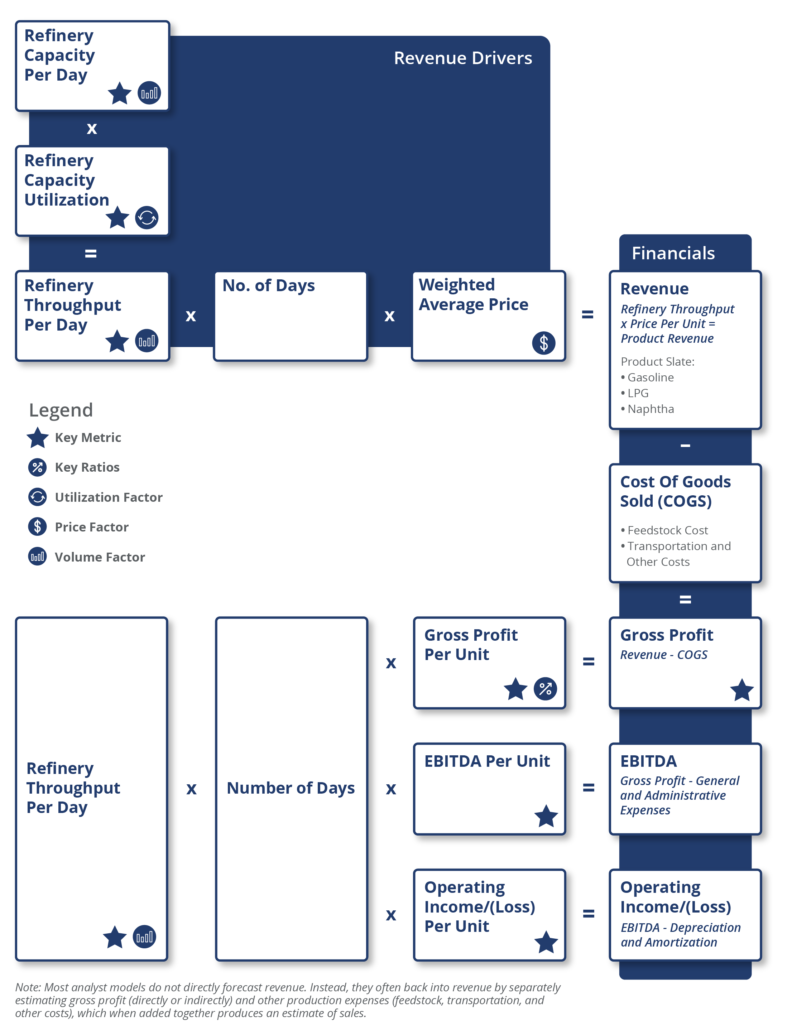
A refinery’s capacity per day is the maximum amount of crude oil designed to flow into the distillation unit of the refinery per day.
Marketing Business Model
As with refining, marketing profitability is tracked on a margin per barrel (or per ton) basis. Additionally, there are no standard industry margins to benchmark marketing performance. Individual product margins are driven by international and regional spreads (in the wholesale market).
Spot prices, often referred to as refinery gate pricing or bulk pricing, are generally the lowest price paid for refined products. Spot purchasers (speculators, other oil companies, utilities, large industrial users, etc.) are usually responsible for product transportation beyond the refinery’s gate. A majority of refined products sold in the U.S. pass through some form of wholesale distribution network. Wholesale margins and prices vary directly with refined petroleum product spot prices. The wholesale to spot price spread comprises a transportation differential and small return on transportation assets.
Both spot and wholesale product prices tend to react almost instantaneously to crude price fluctuations whereas retail prices typically take up to eight weeks to fully absorb price spikes. During a typical driving season in the U.S., wholesale prices rise gradually from May through the middle of August, leaving retailers behind the pricing curve. On the positive side, a deceleration of summer pricing often fails to materialize at the pump until well into the fall. These observations lead to perhaps one of the best-known truisms in the downstream industry: quickly rising crude oil prices consistently erode refining margins and almost eliminate retail margins in the short term, while falling crude prices sometimes benefit refining margins but invariably expand retail spreads.
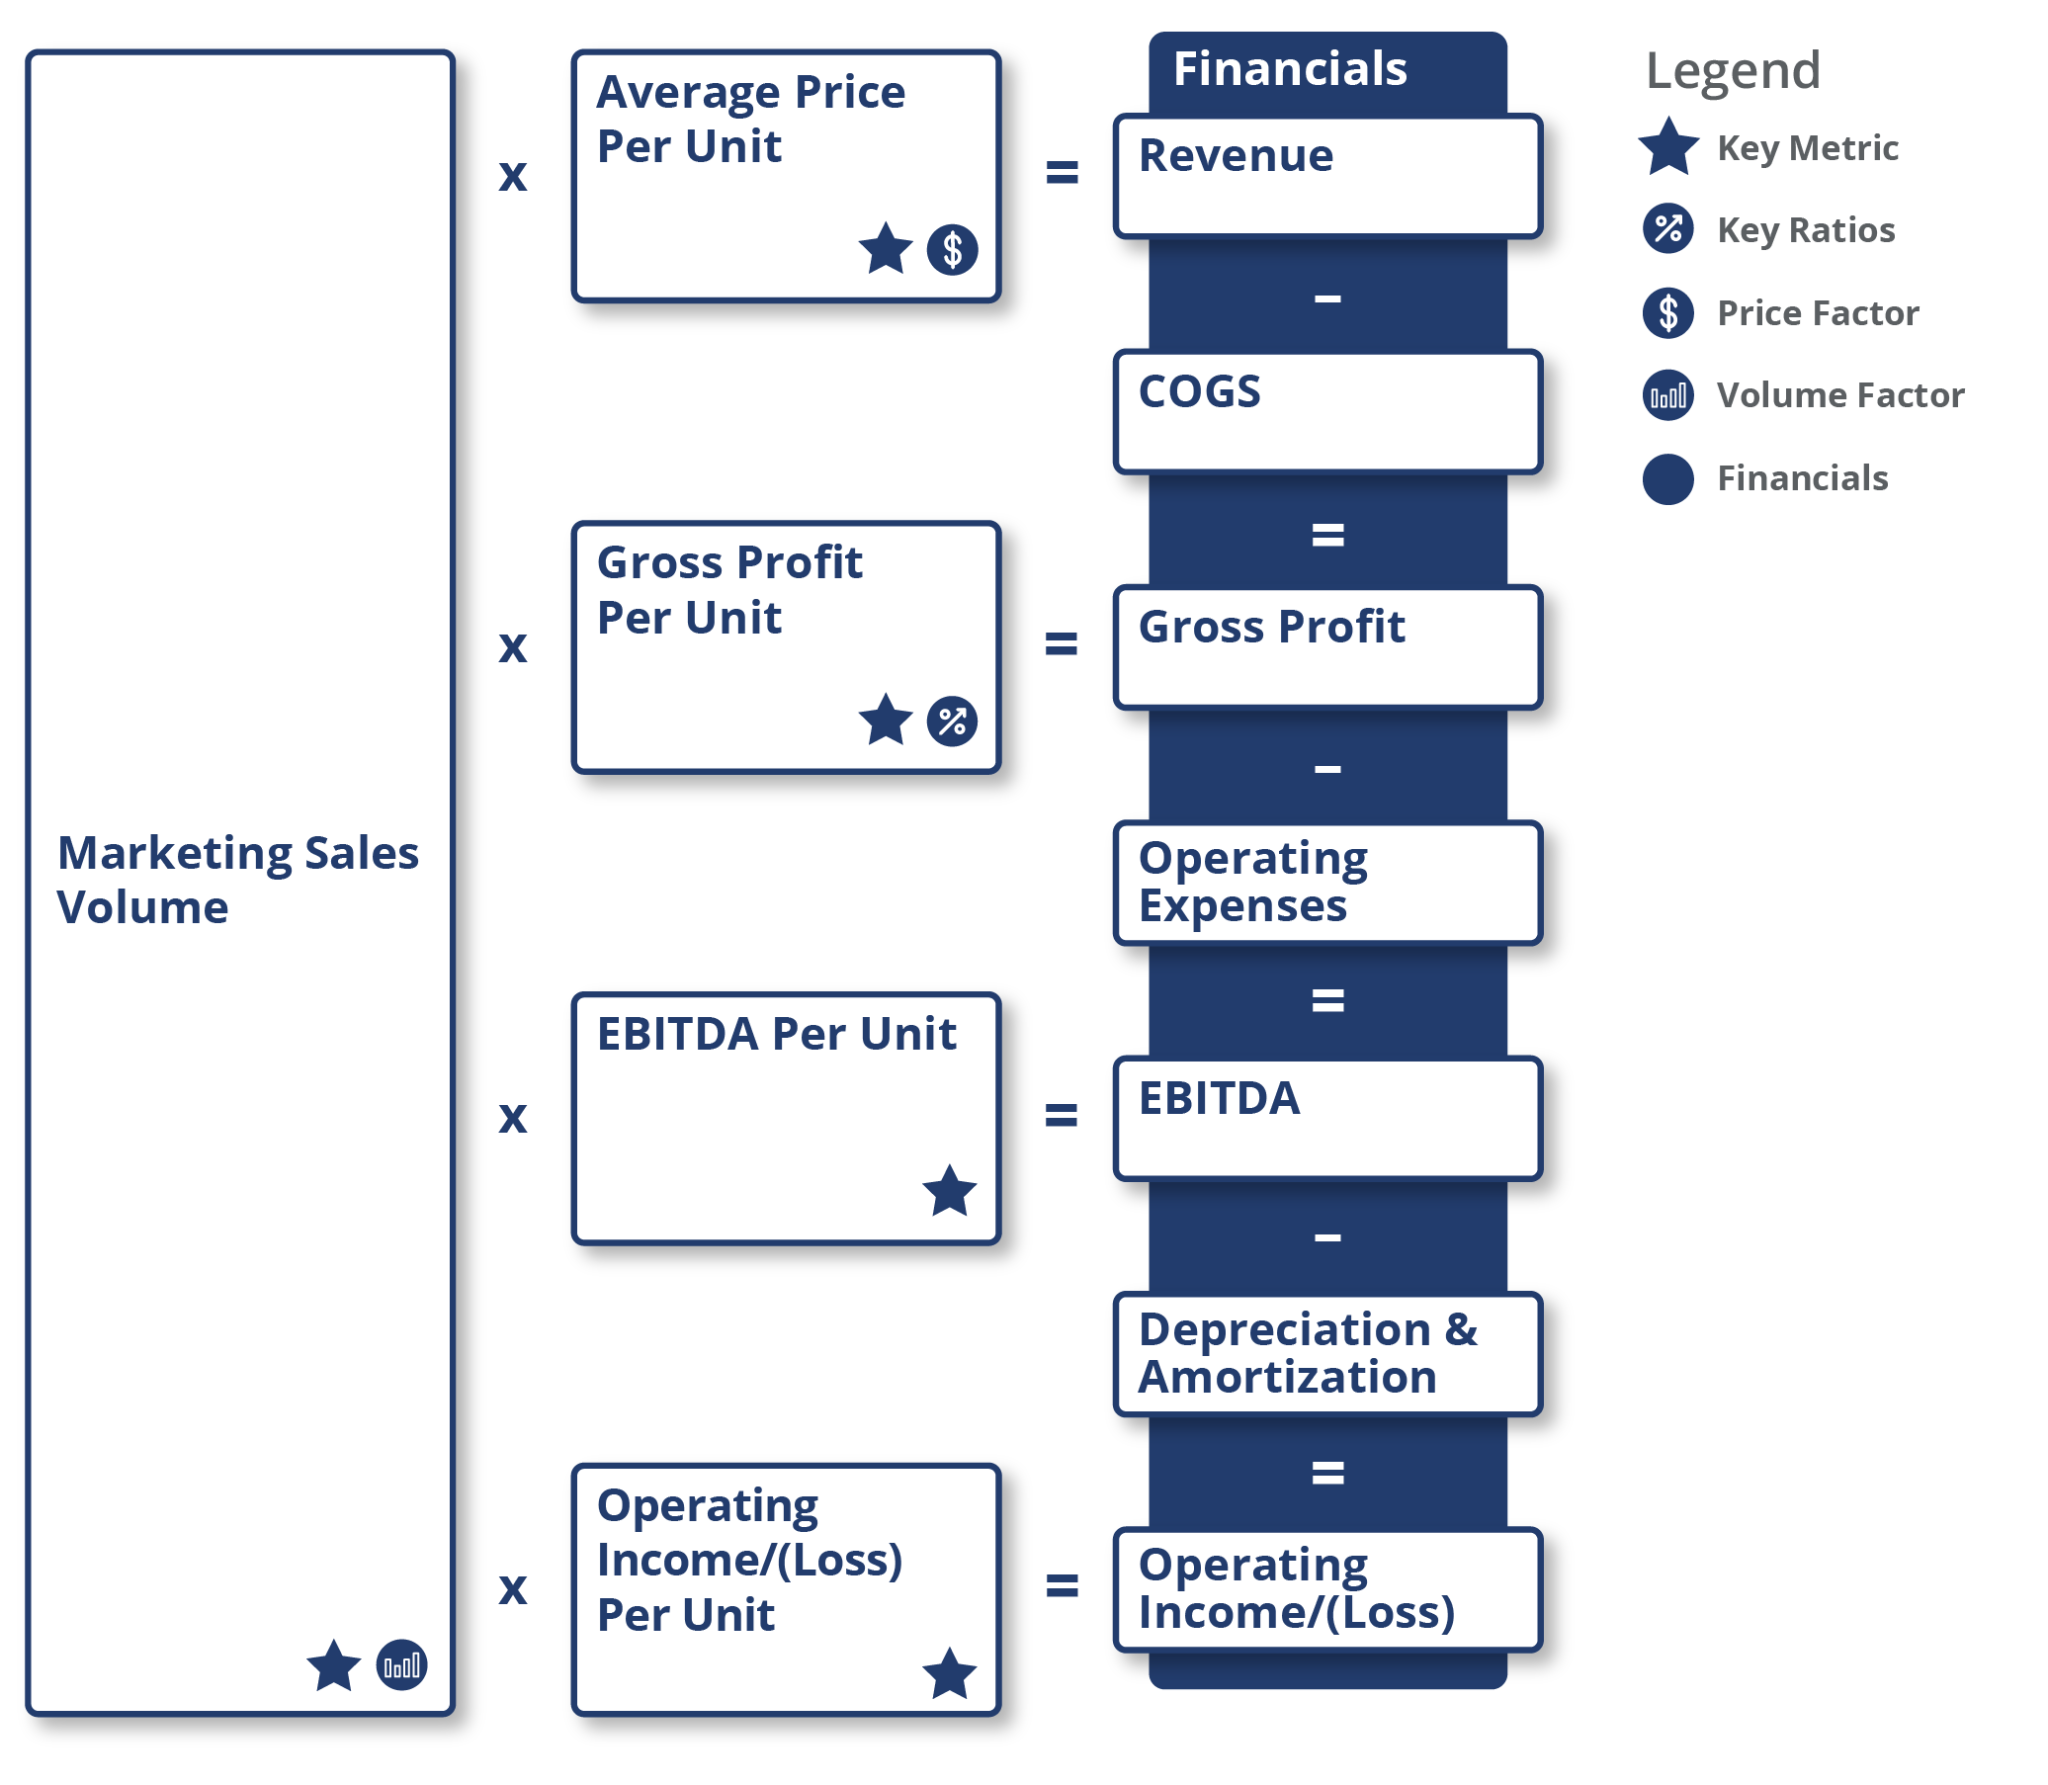
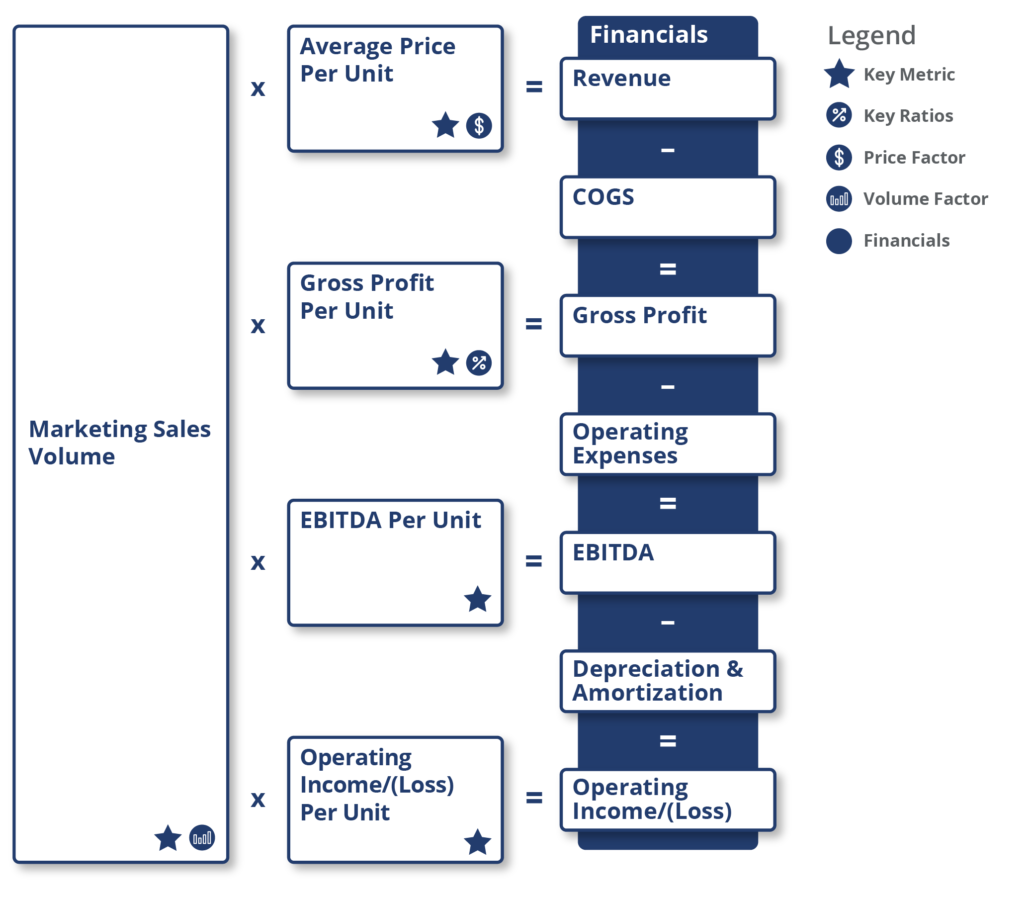
Oil & Gas Marketing Industry Business Model
CLICK DIAGRAM TO EXPAND
Key performance indicators (KPIs) are the most important business metrics for a particular industry. When understanding market expectations for the Oil & Gas Refining and Marketing industry, whether at a company or industry level, some KPIs to consider include:
Visible Alpha’s Standardized Industry Metrics
To understand market expectations for the Oil & Gas Refining and Marketing industry, a key information source is sell-side analyst estimate and consensus forecast data. The buy-side, sell-side, and public companies leverage this type of data to conduct competitive analysis, a type of analysis conducted by professional analysts that involves comparing standardized metrics of one company with those of similar companies. Because companies report metrics differently – and sometimes report on different metrics altogether – standardizing the key metrics for each company can be a cumbersome process.
Visible Alpha Insights includes analyst data, company data, and industry data at a level of granularity unparalleled in the market. Our industry data – Standardized Industry Metrics – enables market participants to quantify and compare market expectations for companies across 150+ industries.
Data as of January 2023
Industry KPI Terms & Definitions
Visible Alpha offers an innovative, integrated experience through real-time, granular consensus estimates and historical data created directly from the world’s leading equity analysts. Using a subset of the below KPIs, this data can help investors hone in on the key drivers of companies to uncover investment opportunities. Learn More >
Refining
Bbl
Bbl is the abbreviation for barrel(s) of crude oil. In the oil and gas industry, one oil barrel equals 42 U.S. gallons.
Bbl/d
Bbl/d (or BPD, barrels per day) is the abbreviation for barrel(s) of crude oil per day.
Standardized Measures
Standardized measures are a set of non-GAAP supplemental financial data reported by U.S. E&P companies as per the SEC regulations. They include standardized measures of discounted future cash flows from the production of proved reserves and help investors make comparisons between companies.
Refinery Capacity
A refinery’s capacity is the maximum amount of crude oil designed to flow into the distillation unit of the refinery, also known as the crude unit.
Refinery Capacity Per Day
A refinery’s capacity per day is the maximum amount of crude oil designed to flow into the distillation unit of the refinery per day.
Refinery Throughput
A refinery’s throughput is the amount of crude that goes into the refinery for processing into various products.
Refinery Throughput Per Day
A refinery’s throughput per day is the amount of crude that goes into the refinery for processing into various products per day.
Refinery Capacity Utilization (%)
Refinery capacity utilization is the ratio of the total amount of crude oil that runs through the refineries to the operable capacity of these refineries.
Refinery Yield
Refinery yield is the amount of finished product produced from the input of crude oil.
Refinery Yield Per Day
Refinery yield per day is the amount of finished product produced per day from the input of crude oil.
Gross Refining Margin (GRM)
Gross refining margin (GRM) is the difference between the total value of petroleum products coming out of a refinery and the price of the raw material, typically crude oil.
Refining Gross Profit/(Loss)
Gross profit/(loss) – Refining is the gross profit or loss incurred by a refinery for a given period.
Refining Gross Profit Per Unit
Gross profit per unit – Refining is the realized gross margin of a refining company.
Refining EBITDA
EBITDA – Refining is the EBITDA of a refining company, which is computed after deducting operating expenses.
Refining EBITDA Per Unit
EBITDA per unit – Refining is EBITDA – Refining on a per-unit basis. It is computed by dividing EBITDA – Refining by refinery throughput.
Refining Operating Income/(Loss)
Operating income/(loss) – Refining refers to the operating income or loss of a refining company, computed by subtracting depreciation and amortization expense and refining from EBITDA – Refining.
Refining Operating Income/(Loss) Per Unit
Operating income/(loss) per unit – Refining is operating income/(loss) – Refining is on a per-unit basis. It is computed by dividing operating income/(loss) by refinery throughput.
Marketing
Marketing Sales Volume
Marketing sales volume is the volume sold by a company in a given period. It can differ from refinery yield if the company wants to increase or decrease final product inventory.
Average Price Per Unit – Marketing (Per Gallons)
Refers to sales price realized from Marketing sales volume. Computed by dividing Revenue – Marketing by Marketing sales volume
Marketing Gross Profit Per Unit (Per Gallons)
Gross profit per unit – Marketing (per gallons) refers to the realized gross margin of a company from marketing finished petroleum products. It is computed by dividing gross profit by marketing sales volume.
Marketing EBITDA Per Unit (Per Gallons)
EBITDA per unit – Marketing (per gallons) is EBITDA – Marketing on a per-unit basis. It is computed by dividing EBITDA by marketing sales volume.
Marketing Operating Income/(Loss) Per Unit (Per Gallons)
Operating income/(loss) per unit – Marketing (per gallons) is on a per-unit basis. Computed by dividing Operating income/(loss) by Marketing sales volume.
Download this guide as an ebook today:
Guide to Oil & Gas Refining & Marketing Industry KPIs for Investment Professionals
This guide highlights the key performance indicators for the oil & gas refining & marketing industry and where investors should look to find an investment edge, including:
- Oil & Gas Refining & Marketing Industry Business Model & Diagram
- Key Oil & Gas Refining & Marketing Industry Metrics PLUS Visible Alpha’s Standardized Industry Metrics
- Available Comp Tables
- Industry KPI Terms & Definitions

