Forecasting the Global Impact of Covid-19 on the Airlines Industry

The global impact of Covid-19 on the travel industry (and across all sectors) has been quite significant, especially as consumers and businesses are still wary of travel risks. Airlines in particular continue to encounter headwinds and the road to recovery is expected to be long and rocky.
In mid-May, we analyzed analyst forecasts for four major U.S. airlines: Delta (DAL), United (UAL), American (AAL) and Southwest (LUV). At that time, we found that expectations were that these airlines would lose 50-60% of their revenue, and recovery would not happen quickly.
“The most optimistic analyst estimates are forecasting that it will take the four largest U.S. airlines until 2022 for sales to recover back to 2019 levels, while the average analyst estimates show it may take until 2024. The most bearish analysts believe it could take even longer.”
Also, in late June, we looked at European airport operators, which analysts also expected to experience a long road to recovery. Analysts were forecasting that “a full recovery back to 2019 revenue levels may not occur until after 2023.”
What are analysts expecting for airlines now?
All data as of September 7, 2020. The sample is based on the largest airlines in the U.S., Europe and Asia tracked by Visible Alpha. For more information, view Visible Alpha’s airlines industry guide.
Capacity Cuts
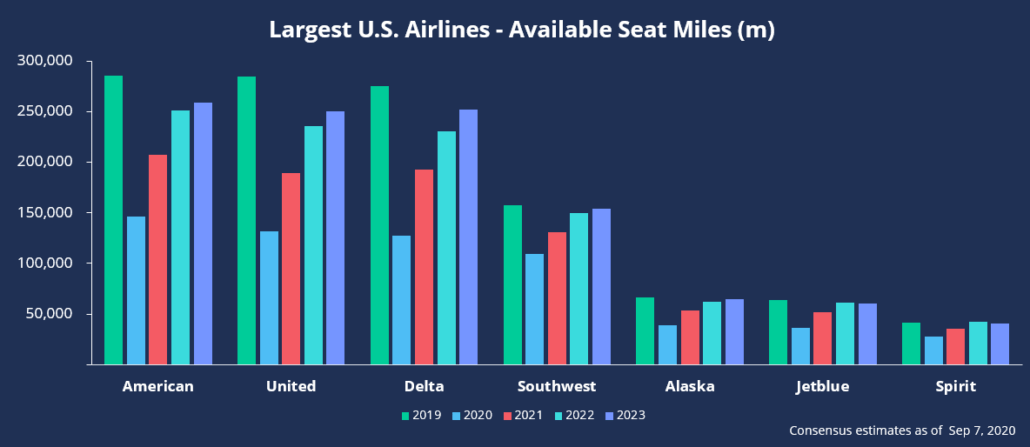
A key performance indicator of capacity is available seat miles (ASM), calculated by taking the number of seats available and multiplying by the distance flown.
In the U.S., we’ve seen greater than 50% cuts in capacity across the board. The road to recovery appears long and uneven, with consensus estimates showing that many U.S. airline companies will not reach 2019 ASM levels through 2023.
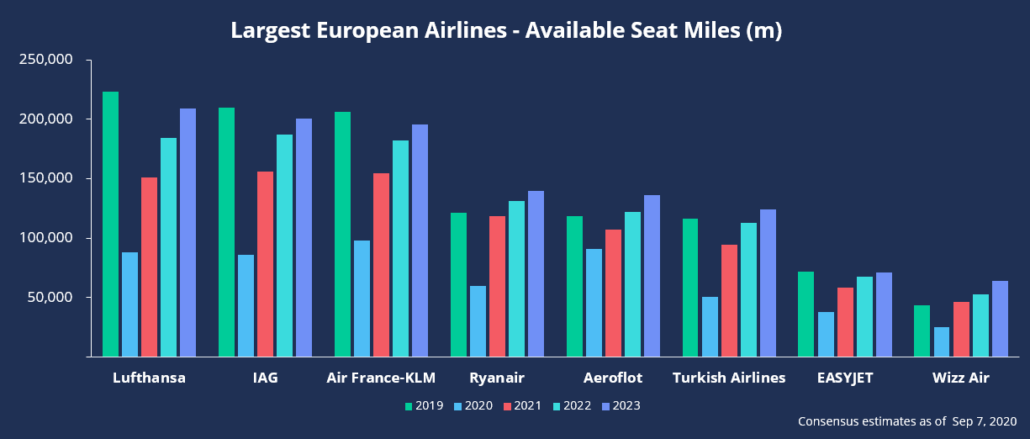
Europe has also seen drastic cuts in ASM, with a similar recovery pattern emerging.
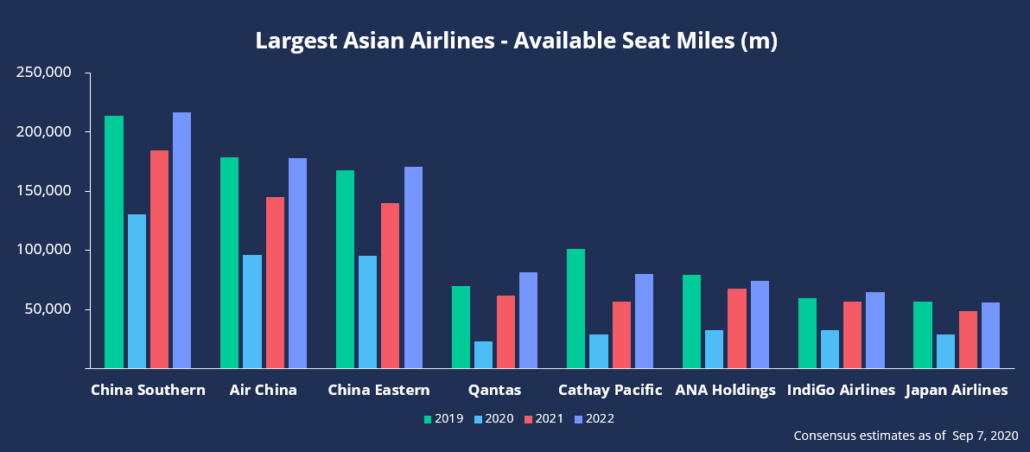
While no region or airline has been spared, Asian airline companies have seen the smallest cuts to capacity and are projected to return to 2019 levels within two years (by 2022). In fact, across the globe, Chinese airlines have seen the smallest decline in capacity.
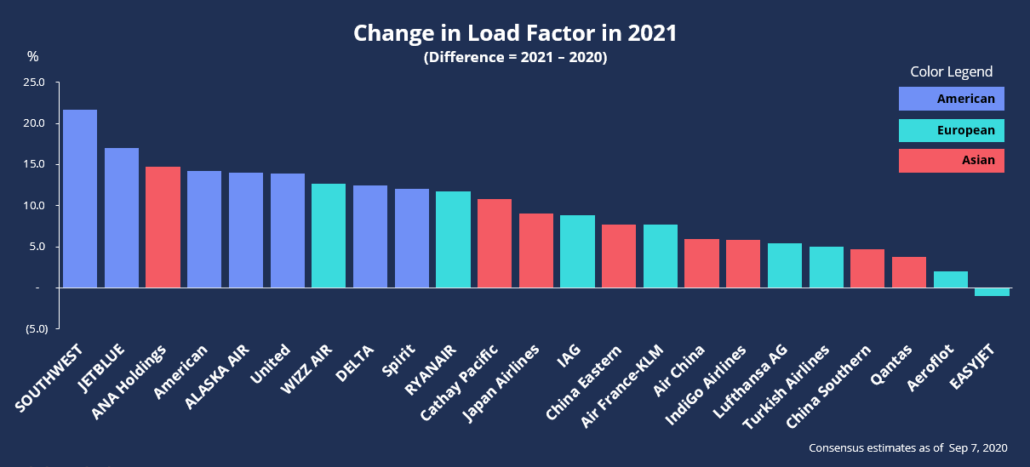
Utilization
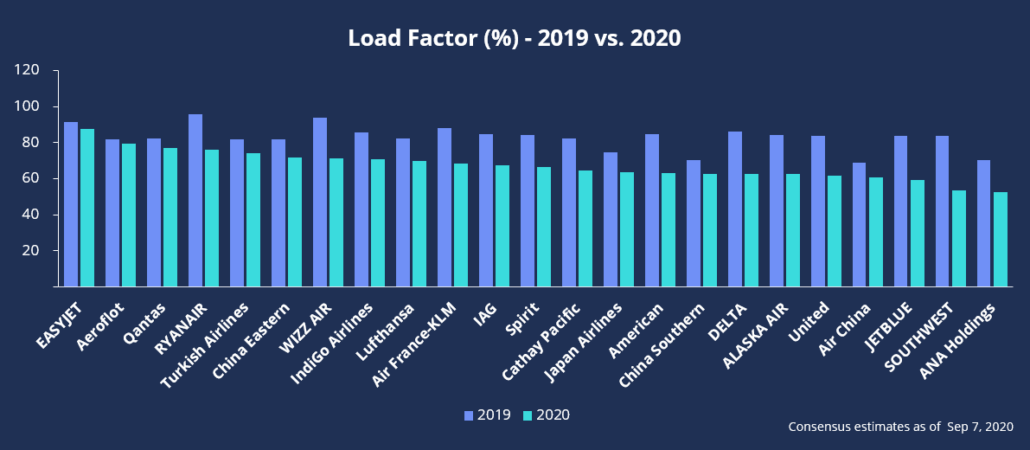
A key performance indicator for utilization is passenger load factor, the number of revenue passenger miles (RPMs) expressed as a percentage of ASMs (RPMs divided by ASMs). Load factors will tell you how many seats are being filled on the routes flown.
Global declines in load factors range from -2% to -30% between 2019 and 2020, with the sharpest reversals in 2021 seen for U.S. airlines, given that they posted some of the most significant declines.
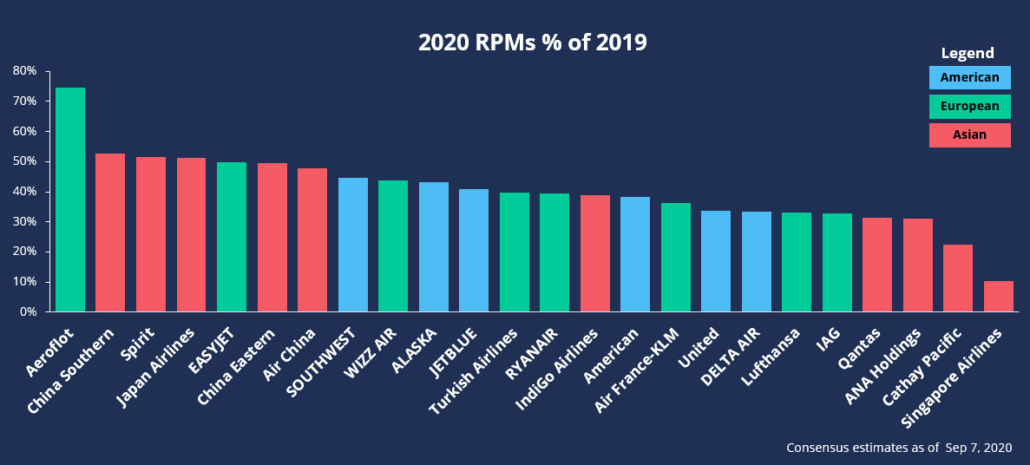
Airline Traffic
A key performance indicator for volume is revenue passenger miles (RPMs), calculated by multiplying available seat miles by load factor. The combination of fewer seats filled (lower load factors) on fewer routes flown (capacity withdrawn from the system in ASMs) magnified the decline seen in the 2020 numbers. Most of the major airlines we track have RPM forecasts running 50% or lower than those seen in 2019.
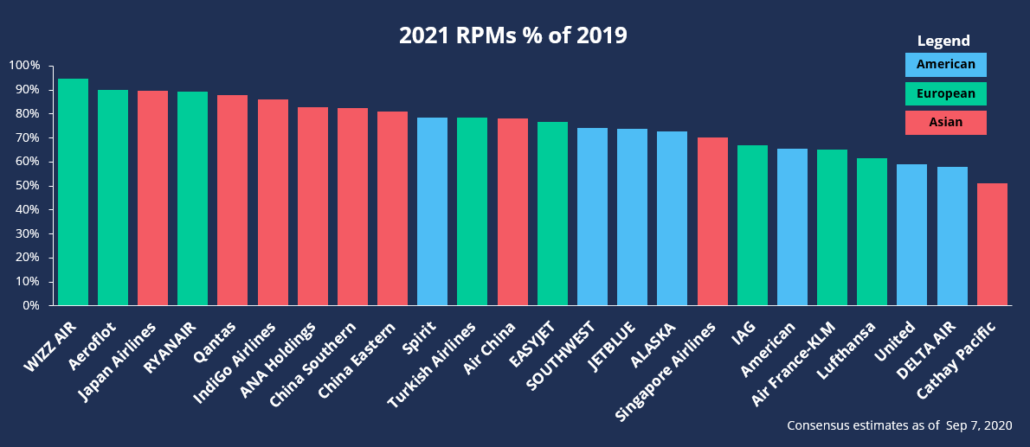
For 2021, we see the most robust recoveries among Asian-focused airlines and European low-cost carriers, which suggests a stronger recovery in demand than in the U.S.
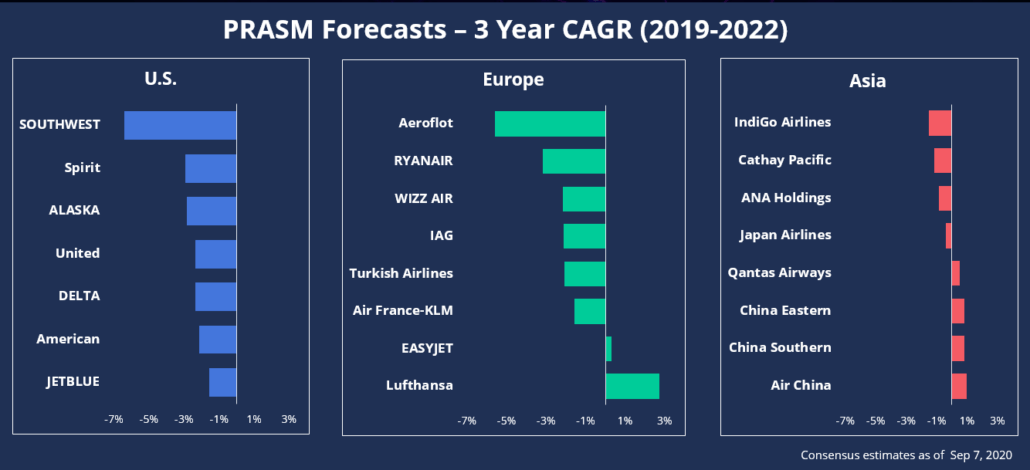
Passenger Yields (PRASM)
Finally, the last measure we looked at was PRASM, a unit price factor that presents passenger revenue on a per-mile basis. PRASM is calculated by dividing passenger revenue by revenue passenger miles (RPM).
To identify trends in pricing among companies, geographies and categories (LCCs vs. flag carriers), we computed the three-year compound annual growth rate in PRASM. Our data shows that analysts expect airlines in Asia – and particularly those in China – will post the strongest (or smallest declines) in unit pricing, followed by airlines in Europe. The U.S. trends are more challenging, suggesting reductions in pricing power over the next few years.
For more information on the key performance indicators in the airlines industry, read our airlines industry guide.


