With little investor optimism, is there a bright spot for Under Armour?

Under Armour (UA) has not had a great 2017 so far. Since the start of 2017, the stock has declined by over 50%. After reporting 3Q17 earnings on 10/31, the stock declined by over 20%. Using the Visible Alpha Insights platform, we try to better understand the negative reaction they’re receiving.
We dive into
- Where UA over/underperformed relative to analyst expectations
- The magnitude of revisions before and after the quarter results
- Analyst growth rate expectations
- A possible bright spot for UA
Earnings Surprise
In order to determine where the company over or underperformed relative to analyst expectations, we apply Surprise visualizations. At-a-glance, we can understand how UA has been performing through the heat map. Focusing on key metrics of interest (Apparel, Footwear and Accessories segments), we discover that Apparel and Accessories underperformed while Footwear overperformed in 3Q17.

Analysts estimated Apparel revenue for 3Q17 at $1,017.6 million and Accessories revenue at $131.6 million. UA reported Apparel at $939.4 million (-7.69%) and Accessories at $123.5 million (-6.16%). Consensus estimates for Footwear were $279.5 million and reported at $285.1 million (+1.99%).
Revisions
In addition to understanding how UA performed relative to estimates, it’s important to understand the magnitude of analyst revisions before and after the quarter results. Through Revisions visualization, you can see how metrics have changed over time.
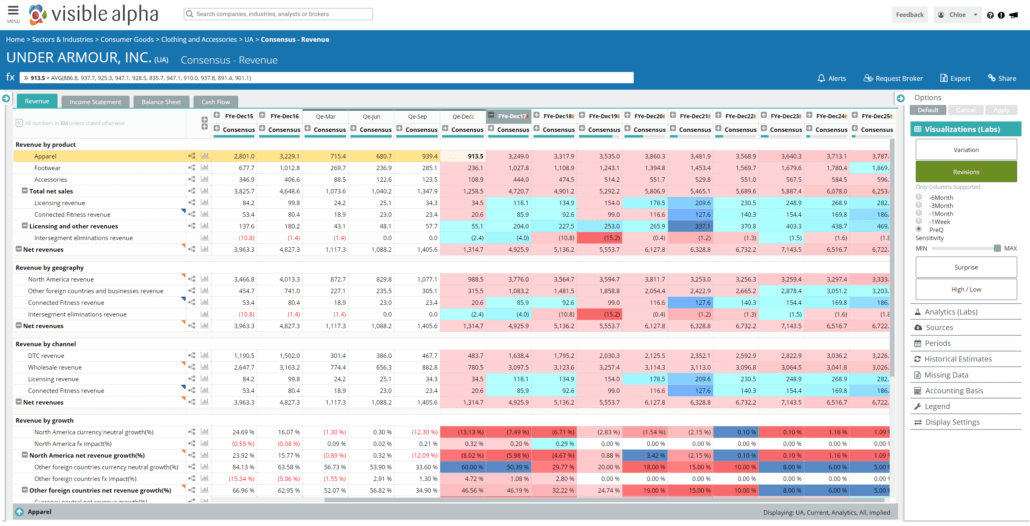
The results reveal the majority of metrics were revised down by analysts PreQ. Hovering over a data point will provide insight into what the metric was before it was revised down.
To understand how a particular data point has been revised over time, right click the data point and select Revision chart. The Revision chart informs us that from the start of 2017 there has been a significant downward revision of UA’s Apparel segment. Furthermore, the results of their 3Q earnings report on 4Q estimates is apparent. After reporting 3Q earnings, 4Q estimates were revised from $1,090.8 million down to $913.5 million.
Year-Over-Year Growth
As we look at the past to understand 3Q’s effect on UA, it’s important to ask: what growth rates do investors expect going forward?
With Visible Alpha, there are two methods to view year-over-year growth rates.
Growth Rates:
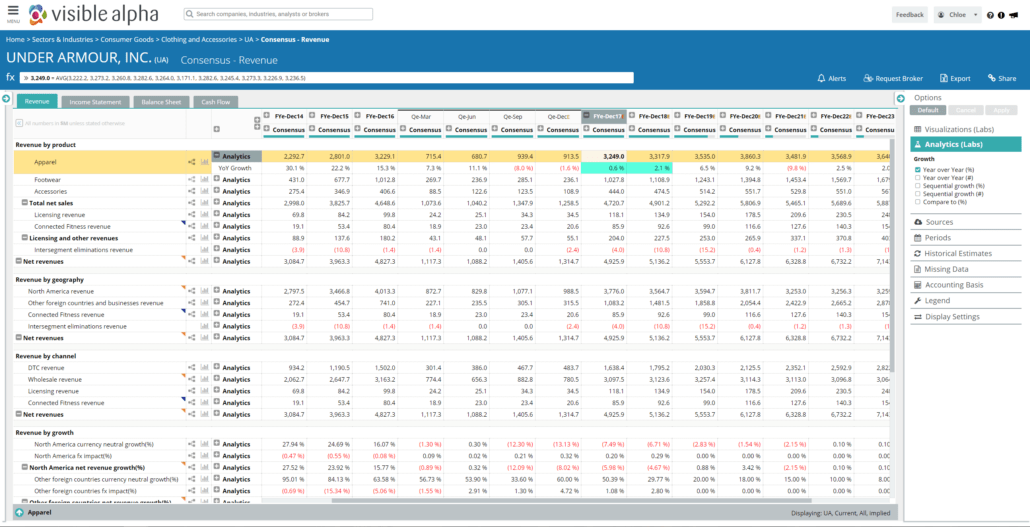
Growth rate analytics can be applied to all line items. For our purposes, we apply year-over-year (%) analytics and expand the metrics for the Apparel segment. By doing so, we see analysts are expecting just 0.6% Apparel growth in 2017 and 2.1% in 2018.
Annual Trend Chart:
Another way to examine growth rate is through a trend chart. By right clicking into any row and selecting “trend chart,” you can chart consensus values and growth rates annually over time. We know analysts expect little growth in UA’s Apparel segment, but what kind of growth do they see for UA Footwear? Through the annual trend chart, we see analyst optimism for this segment. They are estimating 1.5% growth in 2017 and 7.9% in 2018.

According to Visible Alpha, analysts are estimating a higher growth rate for UA’s Footwear segment in 2018 compared to Nike. Year-over-year growth for Nike’s Footwear segment is estimated at 4.7% for 2018, down from an estimated 6.10% for 2017.
While many investors are not optimistic on UA, some see a bright spot: their international business. Using Visible Alpha, we can see that the international business grew 35% to $305 million in 3Q. While the international business underperformed analyst expectations by -8.19% in 3Q, this segment overperformed in both 1Q and 2Q.

Analysts are estimating 46.2% year-over-year growth for UA’s international business. Meanwhile, year-over-year growth for North America revenue is estimated at -5.9% for 2017.
On the conference call with analysts discussing 3Q results, CEO Kevin Plank said, “our international business, by every cut, continues to exceed our expectations, strategically and financially.” It will be interesting to see how UA Footwear and the international business performs in 4Q and throughout 2018.


