Investment Analysis Tools and Techniques Archives - Visible Alpha

Visible Alpha Investment Analysis Tools and Techniques

“Consensus is a lie.” A rather bold statement, don’t you think? When it comes to consensus, we commonly hear:

Consensus is a critical benchmark.

You have to know where the street is.

I don’t care about consensus.

I’m an independent thinker.

The great irony of consensus estimates is that there is no consensus as to the applicability of this data to the investment process.

However, there is one fundamental truth in stock picking: Analysts, directors of research, and portfolio managers must formulate independent views that collectively outperform the market.

The ability to identify unique market opportunities with a differentiated point of view will make or break your success. Interestingly, the fundamental requirement to create differentiated views naturally calls into question the approach of studying ‘consensus.’

However, consensus should not be thought of as a singular datapoint, but rather a collection of views that often differ significantly from one another and change, oftentimes dramatically, through time. Understanding the totality of the market view should, in fact, present opportunities.

Let’s deconstruct notions around consensus further…

What are consensus estimates?

DEFINITION: Consensus can be defined as the average reached by a group of equity analysts who cover a particular stock, regarding the projected earnings and revenues of a public company. It represents the combined estimates derived from individual assessments, forecasts, and subjective inputs of analysts, aiming to predict a company’s financial performance. Consensus estimates serve as a market expectation indicator and can influence investor sentiment and stock price movements.

Consensus estimates serve multiple purposes in the investment landscape:

For investors who have limited time to delve into the intricacies of a company, consensus estimates can serve as a useful tool in forecasting efficiently. They provide a snapshot of market expectations and help identify companies that are forecasted to outperform or underperform other companies in their peer group.

Moreover, consensus estimates can reflect the collective wisdom of the market, offering insights already reflected in the pricing and market sentiment. This creates opportunities for investors to express contrarian views on pricing, revenues, or other variables.

Investors can leverage consensus data to identify the fastest-growing companies within thriving sectors like technology or seek out companies that are emerging within industries facing challenges, such as traditional retail, even in researching publicly traded companies that are contributing to the infrastructure and broad scaling of AI capabilities.

Finally, it is important to note that consensus estimates are not static. As is the case with any investment thesis, consensus evolves as new information becomes available and market conditions change. It is vital for investors to track revisions and understand the dynamics of consensus as investment views are constantly recalibrated for changing market conditions.

Looking Beyond Consensus

When thinking only about consensus as a single data point, it’s understandable why investors may disregard consensus. From an investor’s point of view, consensus is an incomplete metric. Traditionally, consensus, centered on high-level metrics like revenue or EPS, misses out on the intricate factors driving a company’s success.

This narrow perspective can lead investors to overlook valuable insights and unique viewpoints, especially when considering detailed line items beyond basic metrics, found in the dispersion and revision pattern of forecasts from the analyst community. Recognizing the rich source of potential in the spread and revision trend of forecasts from the analyst community becomes crucial for buy-side professionals, as it indicates the presence of varying opinions among analysts as they change through time.

Large dispersion signifies the existence of untapped opportunities, while tight alignment among analysts may indicate limited potential for market gains. Dissenting voices are catalysts for growth and bring high-value unique perspectives to the table.

Example:

Let’s take a closer look at how the analysis of dispersion at a more granular level unlocks these advantages.

On the Q1 2023 earnings call, Meta CEO Mark Zuckerberg emphasized the significant impact of AI on Facebook and Instagram. AI recommendations now contribute to approximately 20% of the content in the feeds. This AI-driven enhancement to content and messaging in feeds has prompted analysts to revise their revenue estimates, reflecting anticipated increases in ad revenue.

VA Beyond the Average

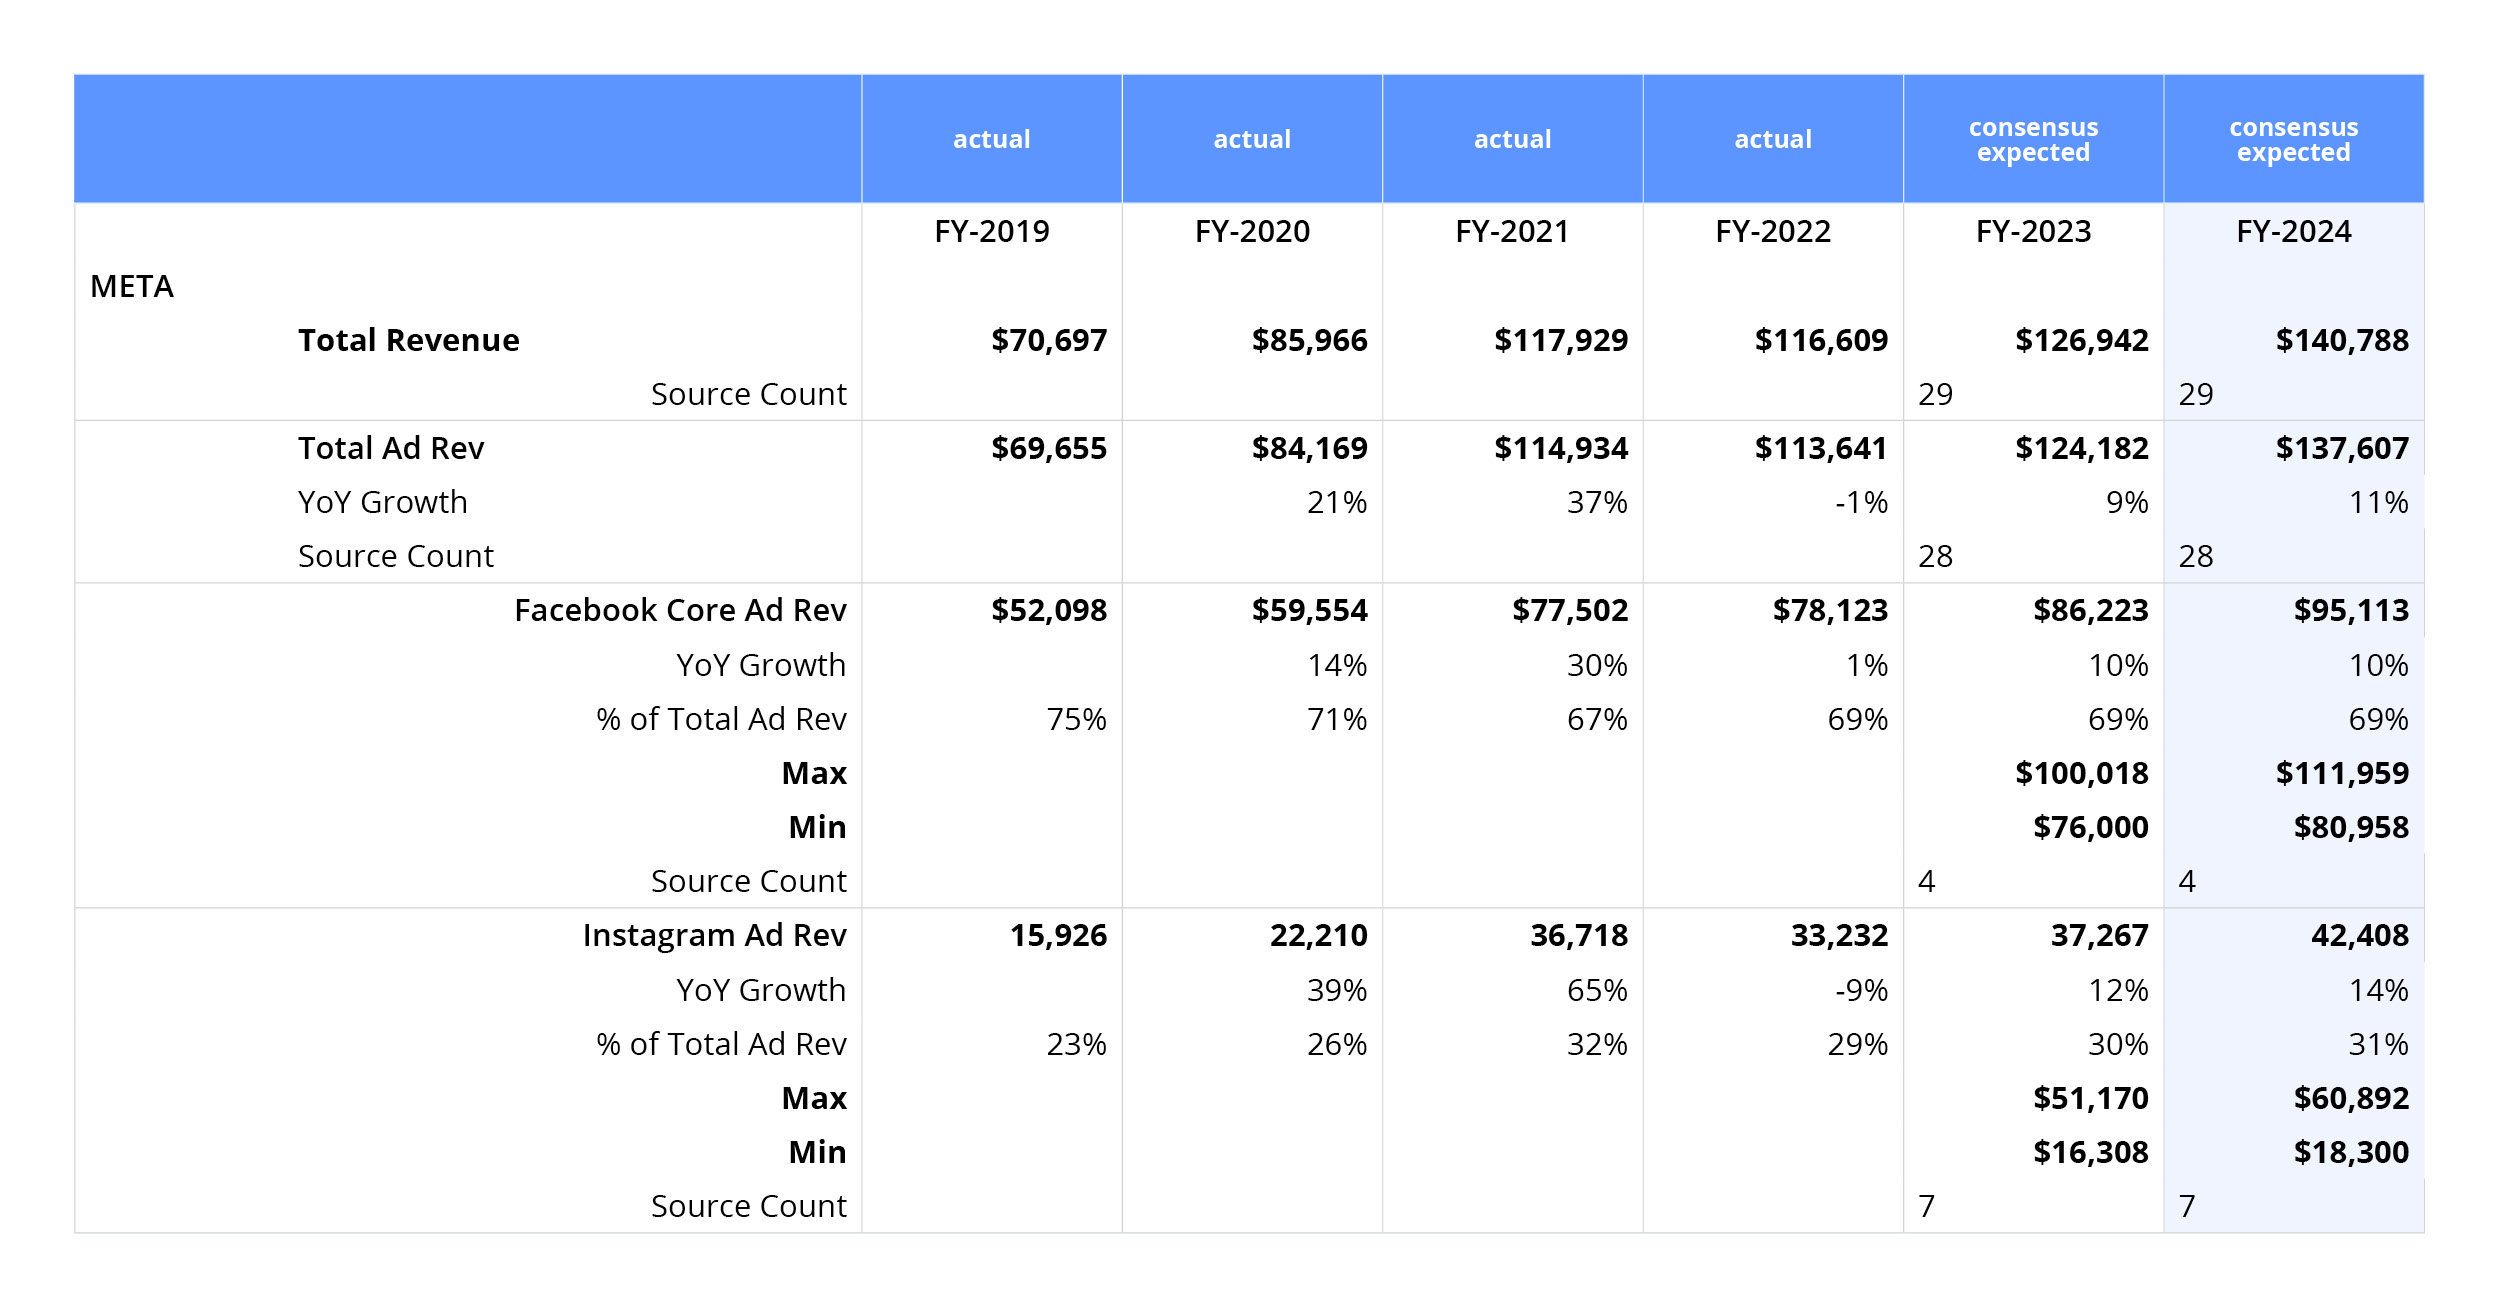
When examining Facebook’s core ad revenues, our platform reveals consensus estimates that have been revised upward. Following Q1 2023, even the most conservative estimates have increased by $9B, narrowing the range. For 2023, the low-end estimate is now $76B (-12% below consensus), while the high-end estimate is $100B (14% ahead of consensus). These unique line items provide crucial insights into the growth potential of Facebook.

Collectively, the potential for AI to impact Facebook’s ad revenue led to a 12% increase in FY2024 expectations relative to consensus on January 3, 2023.

Delving into Instagram ad revenues, Visible Alpha highlights significant debate among the seven analysts forecasting. Varying views and calculations of the Instagram business and its projected growth result in a wide range of estimates. In 2023, estimates range from $16B (-56% below consensus) to $51B (38% above consensus), showcasing the importance of understanding these key drivers of growth.

Looking ahead to 2024, the range of estimates for Instagram ad revenues further expands. The high-end estimate of $61B contributes a remarkable 45% to total revenues, surpassing consensus by 43%. Conversely, the low estimate is -57% below consensus, reflecting the diversity of opinions among analysts.

By leveraging the dispersion of estimates of granular line items and embracing the varied viewpoints within the analyst community, investors can discover valuable opportunities that others might overlook and make informed decisions that set them apart.


consensus cta 2

The status quo

Traditional consensus providers have confined us to a narrow, one-dimensional perspective. Many consensus providers have historically relied on scraping sell-side research reports for analyst estimates, aggregating those estimates, and calculating the mean to create consensus. However, there are limitations with this methodology that hinder our understanding and ability to explore the full breadth of market possibilities:

  1. Lack of granularity: Sell-side research reports typically only include forecasts on top-level line items, such as revenue and EPS. Therefore, traditional consensus providers often miss the granular issues that are central to the investment thesis.
  2. Lack of comparability: The concern about comparability arises because traditional consensus estimates often don’t reveal the specific assumptions analysts make for each forecasted figure. This lack of transparency makes it challenging to compare one analyst’s forecast to another’s effectively, as each may use different bases for their predictions. Clarifying these assumptions is crucial for accurate comparison and a deeper understanding of the investment landscape.

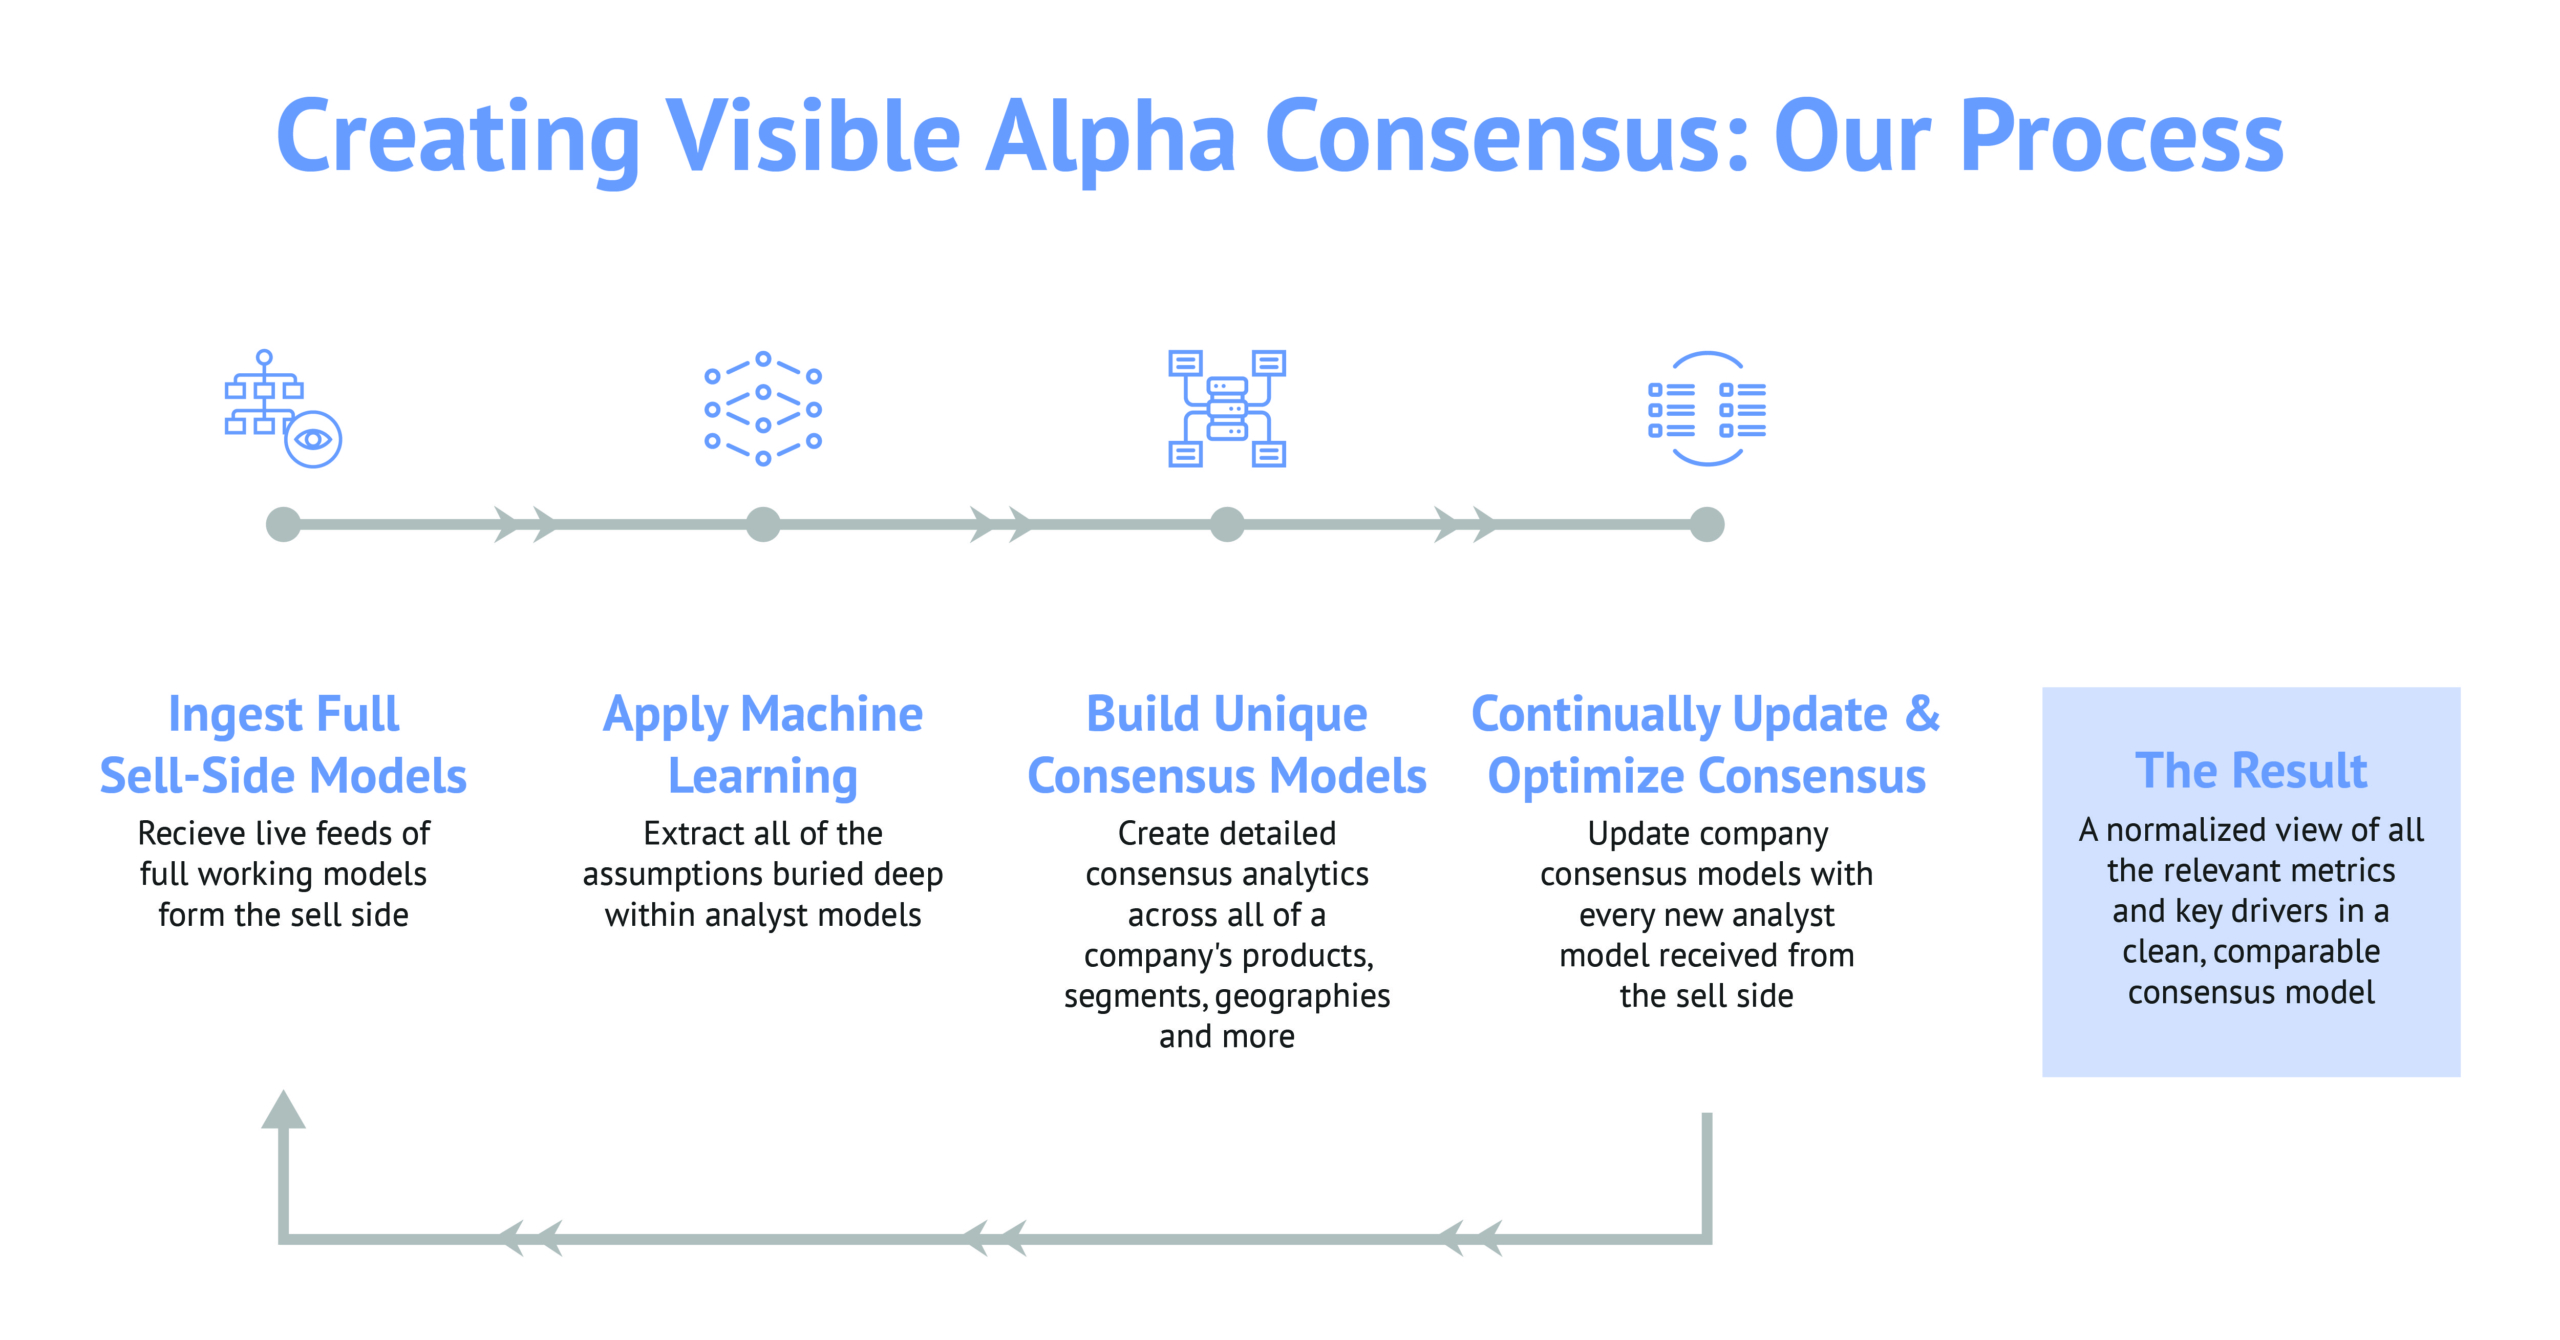
Revolutionizing Consensus Creation

Unlike traditional consensus providers, Visible Alpha goes beyond top-level line items. We provide direct access to sell-side analyst models and offer deep consensus estimates on thousands of companies across various industries. With our tools at your disposal, you can explore the range of opinions and formulate a new perspective on market opportunities.

“Investors are looking for insights to understand what is behind analyst views for any key issue on a company. Visible Alpha’s deep consensus data addresses this buy-side problem of getting complete information about assumptions behind forecasts by providing a complete representation of analyst views sourced directly from analyst models.”

– Rodney Pedersen, Chief Revenue Officer, Visible Alpha

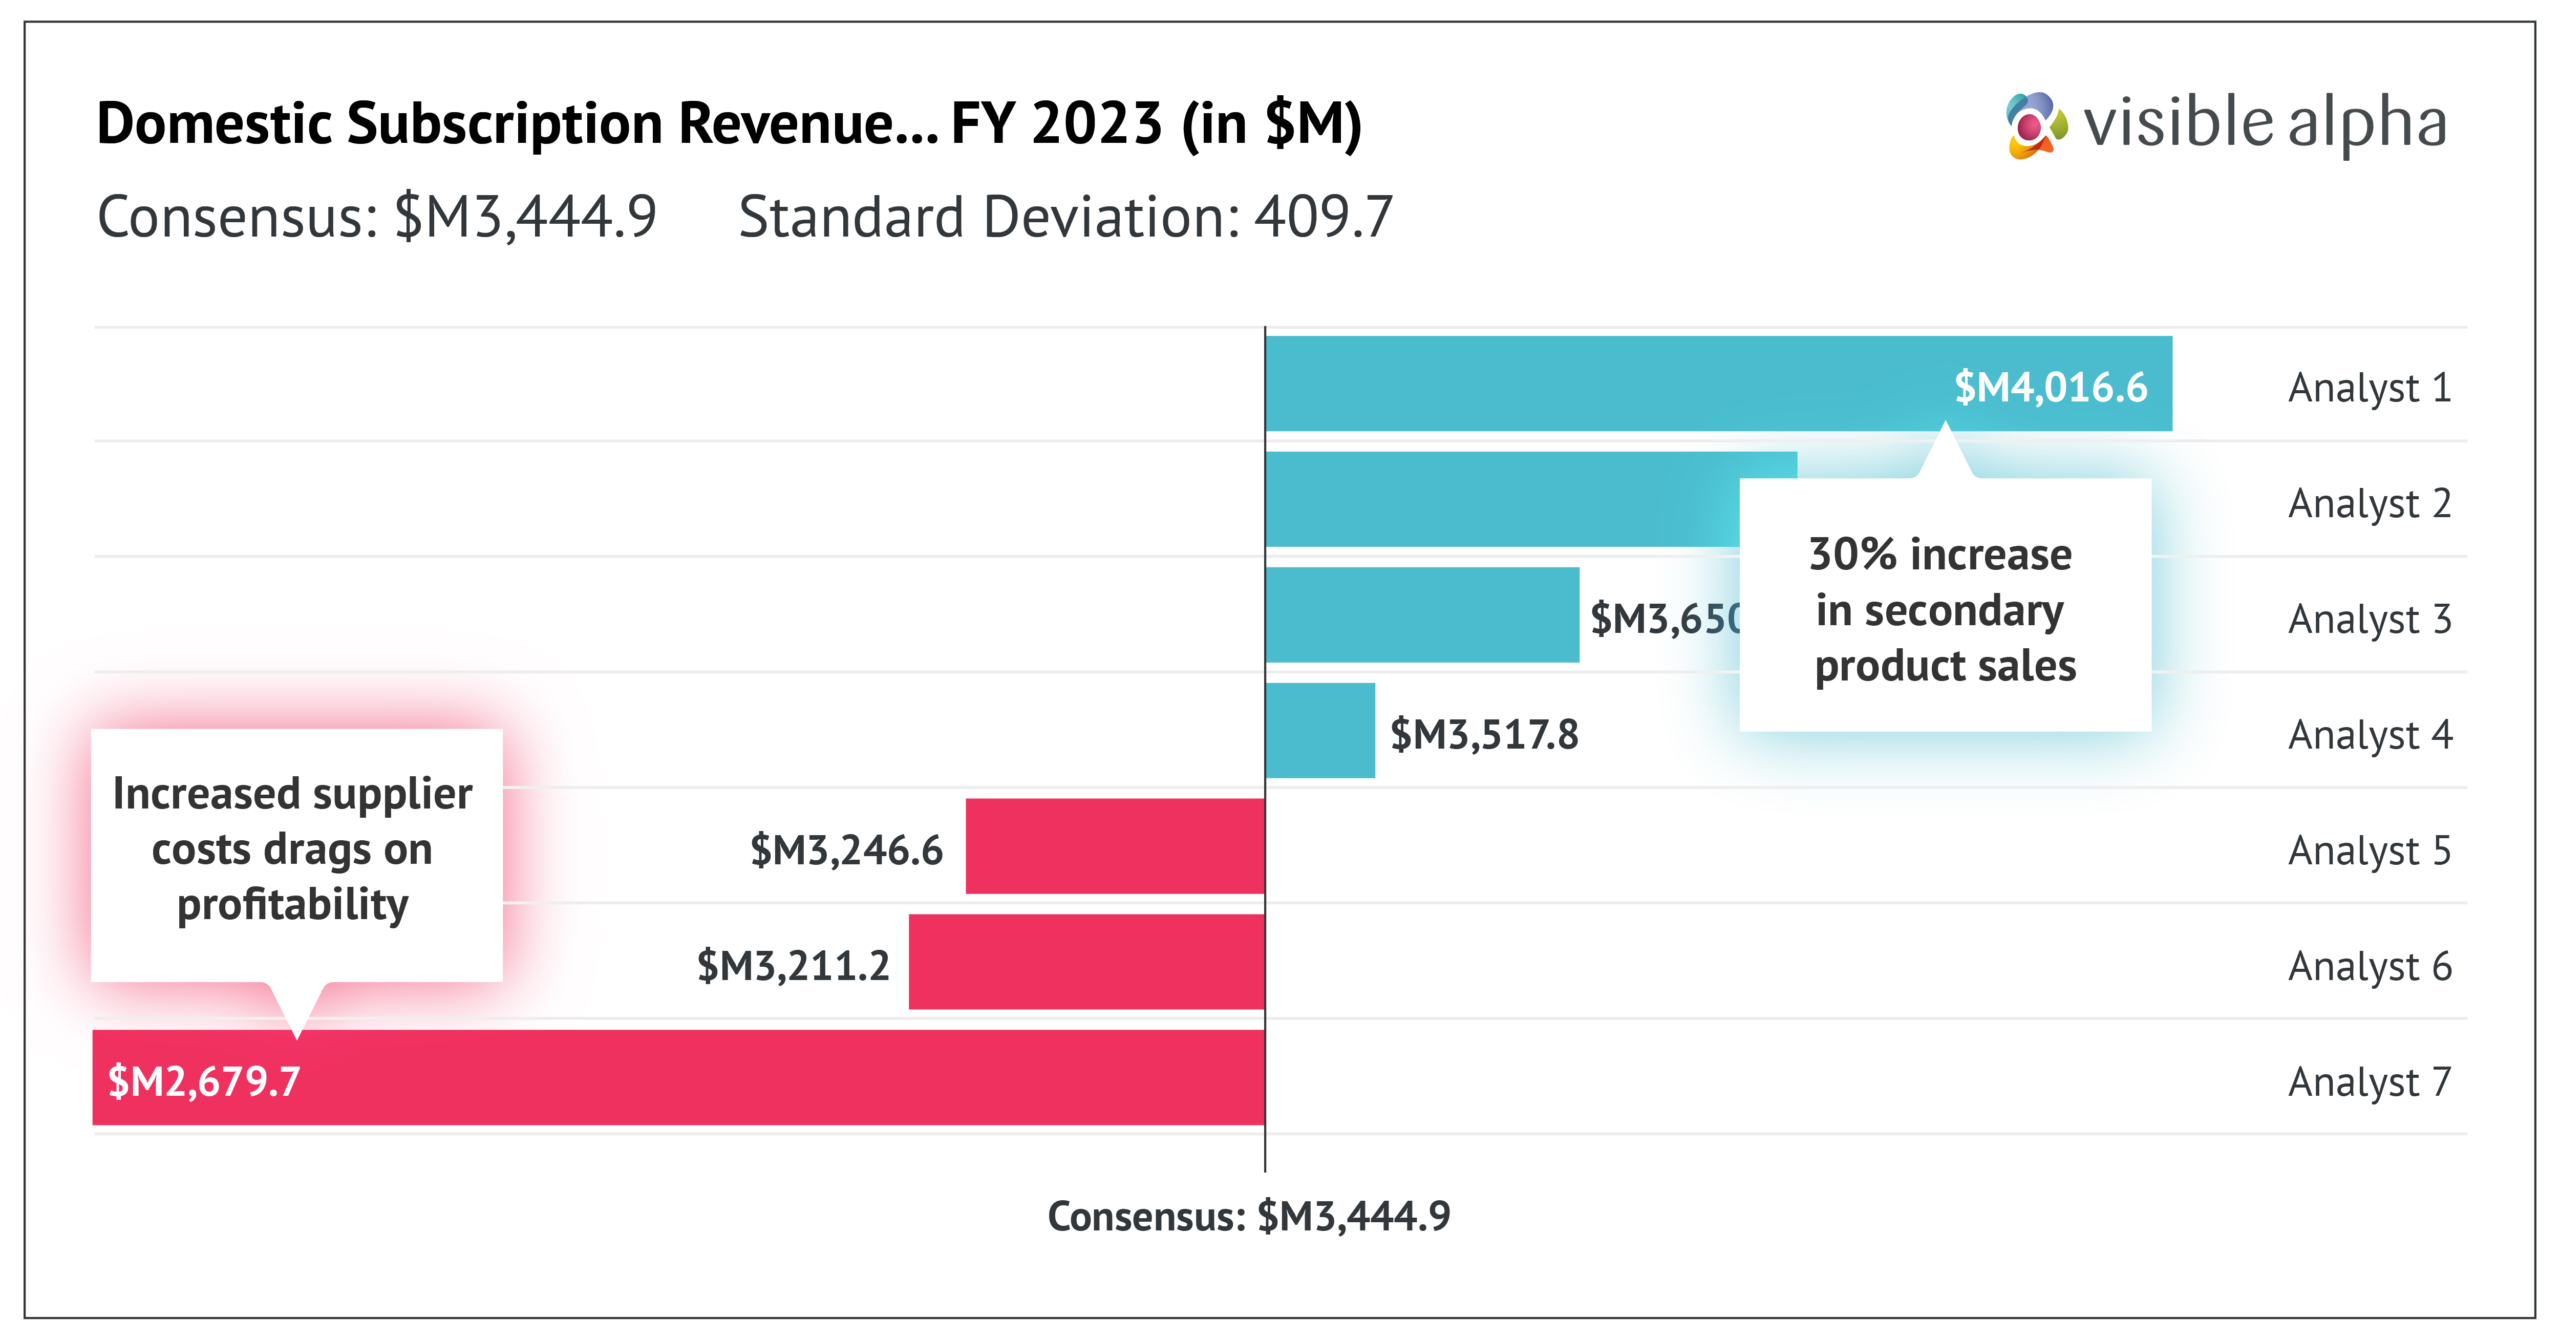
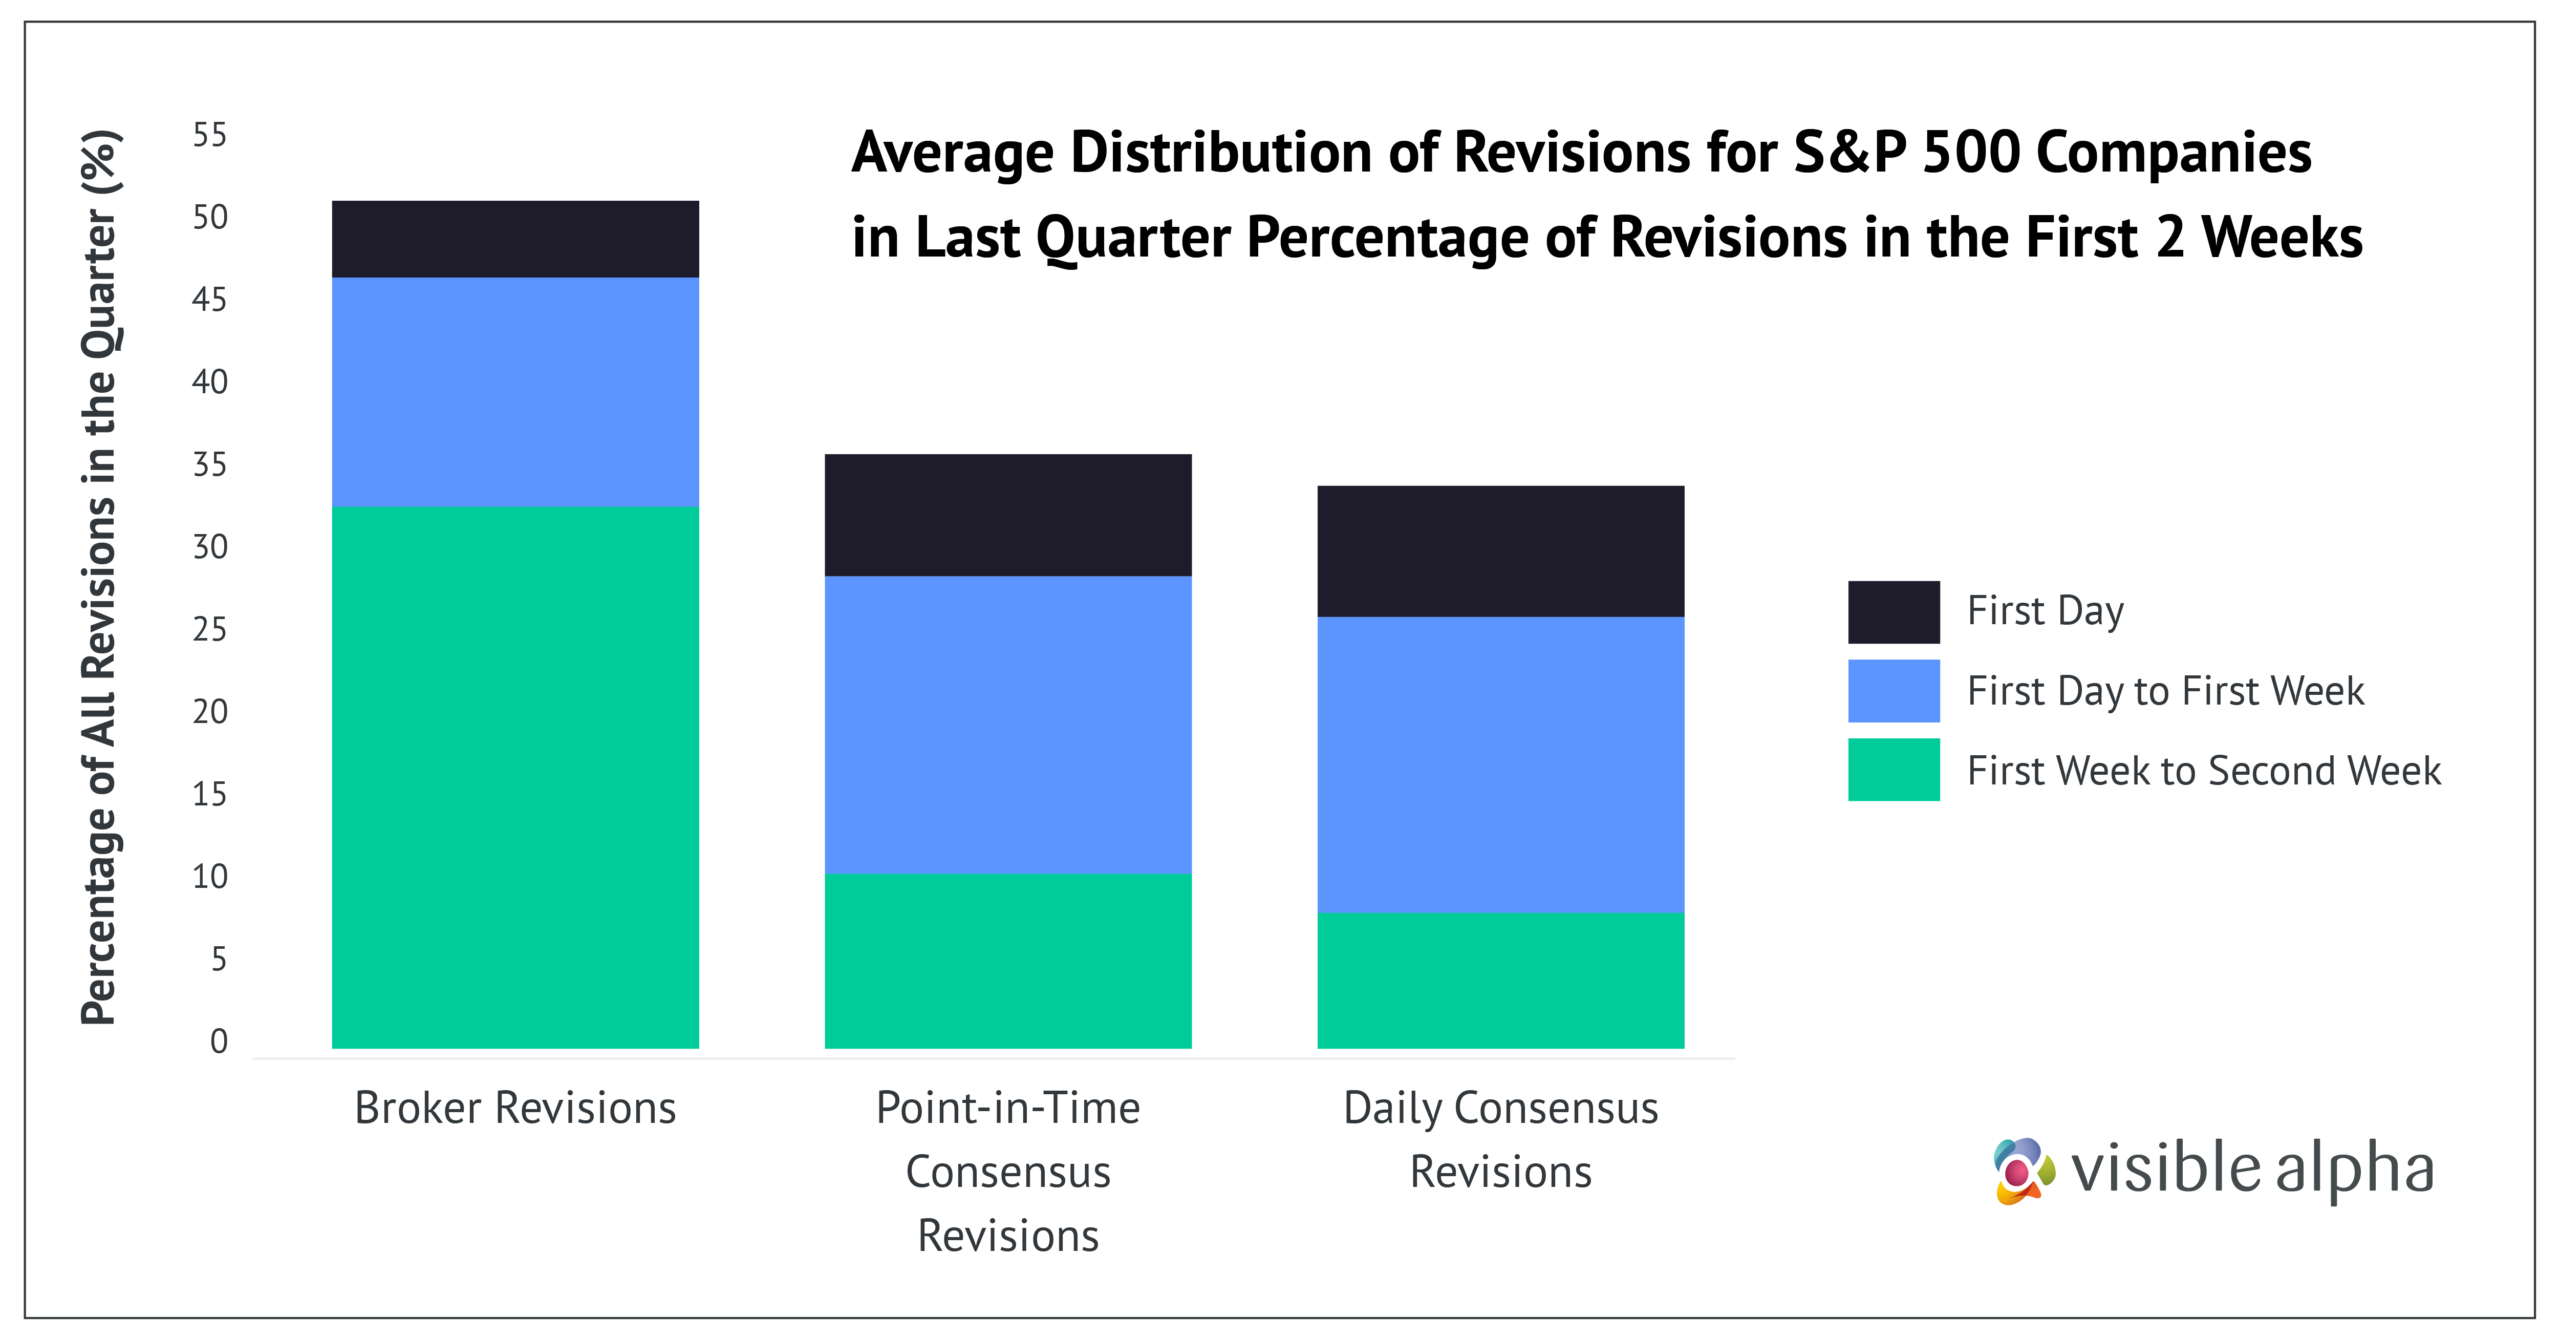
Our platform enables investment professionals and investor relations teams to identify the key drivers of revenue according to analysts’ perspectives. Moreover, we offer full transparency by allowing you to identify the spread of estimates including each individual analyst’s forecast for any line item. Finally, Visible Alpha offers a point-in-time snapshot of historical estimates allowing you to understand how market conviction on key issues is changing through time.

With Visible Alpha, you gain a competitive advantage by accessing consensus estimates with an unrivaled level of granularity, transparency, and historical context. This comprehensive view empowers you to perform relative analyses and extract actionable insights from sell-side models, ensuring that you make informed and independent investment choices.

“Visible Alpha’s consensus estimates can be used to represent what the market believes and what is already reflected in current pricing, providing scope for expressing contrarian views on pricing, revenues, or other variables.”

– Scott Rosen, Founder and Chief Research and Innovation Officer, Visible Alpha

It’s time to go beyond the limitations of traditional consensus, to go beyond the average.

See consensus in a new light with Visible Alpha

In the fast-paced world of finance, where timely decisions can make or break success, the creation and analysis of consensus estimates play a pivotal role. This article delves into the multifaceted world of consensus forecasting, exploring the diverse methods and innovative approaches that shape the financial industry’s understanding of market expectations and company fundamentals.

Traditional Methods: The Backbone of Consensus Creation

How is consensus created?

Consensus estimates can be calculated through a variety of methods and approaches, each with its strengths and limitations. Without a reliable and accurate consensus data solution, creating and analyzing consensus is a meticulous and labor-intensive process for the sell side and buy side alike.

Let’s explore some of the traditional methods through which consensus can be generated:

Manual Sell-Side Analysis:

At the heart of consensus creation lies the meticulous work of sell-side equity research analysts. Sell-side equity research analysts play a crucial role in creating consensus by conducting in-depth research and analysis on the companies and industries within their coverage universes. These analysts carefully evaluate financial statements, industry reports, market trends, macroeconomic factors, and company-specific information to develop their forecasts for key financial and operational metrics. These individual forecasts are then averaged across all covering analysts by the buy side and corporations to create consensus for every line item under coverage. By leveraging their expertise and insights, sell-side analysts contribute to the formation of consensus estimates and historicals, which are, in turn, leveraged by corporate and investment professionals to inform their future decisions.

Pro:

  • Can choose to leverage estimates only from trusted analysts

Cons:

  • Extremely time and resource-intensive
  • Line items are not standardized across different sell-side models
  • Can be difficult to monitor sudden revisions and other critical changes to models

Traditional Consensus Providers:

Traditional consensus providers offer a consolidated view of analyst estimates by aggregating and analyzing the forecasts from sell-side research reports. These providers employ a process of collecting, adjusting, and aggregating the individual analyst forecasts to determine the consensus estimate for headline financial metrics.
While convenient, their reliance on static sell-side reports, which typically only provide top-level financial metrics, may limit the immediacy of data, sometimes failing to capture analysts’ most current projections.

Pro:

  • Consensus estimates are already pre-aggregated, saving time and effort

Cons:

  • Consensus is typically only available for the top-level line items that are available within research reports
  • Manual work is required for creating custom consensus, as well as consensus on more granular company metrics

Provider-Assisted Manual Aggregation:

An intermediary approach involves providers assisting clients by aggregating forecasts from diverse sources, such as sell-side research reports, investment banks, and brokerage firms, offering a consolidated view. This is a labor-intensive task consisting of aggregating models and creating consensus estimates. This method, leveraging expertise and technology, provides a more auditable consensus estimate while alleviating the labor-intensive burden on clients.

Pro:

  • Facilitates more well-rounded consensus while also generating significant time savings

Cons:

  • Lack of real-time visibility into changes to individual analyst and consensus estimates
  • Manual labor involved may lead to longer wait times from the provider for any updates

While these traditional consensus creation methods can and do serve investment and corporate professionals’ basic requirements, the various limitations of these methods have necessitated the creation of more innovative approaches to generating accurate and timely market consensus data.


consensus cta 2

Innovations Reshaping Consensus Creation

The Value of Analyst Models

In today’s fast-paced financial landscape, the process of creating consensus estimates can be time-consuming and resource-intensive. However, in addition to the above methods, alternative approaches to consensus creation have emerged, revolutionizing the way data is gathered and analyzed through technology that maximizes efficiency – saving on both time and resources – without sacrificing data quality or freshness. Understanding the fundamentals and mechanics of the actual analyst models becomes paramount in the consensus creation process. Visible Alpha is at the forefront of this innovation, utilizing machine learning algorithms and an in-house team of industry experts to analyze vast amounts of financial and operational estimates and historicals, market trends, and industry KPIs.

Let Us Do the Heavy Lifting

With Visible Alpha, you no longer have to settle for a one-dimensional perspective.

Visible Alpha Insights offers a comprehensive solution that goes beyond the offerings of traditional consensus data providers. Our proprietary consensus methodology is created through pulling data directly from the latest sell-side analyst models, followed by a mix of machine learning and human intervention, and rigorous standards for quality control, empowering you to break free from the consensus echo chamber and explore the full spectrum of market possibilities.

Unlike traditional providers of consensus data, our consensus data – which consists of both estimates and historicals and is normalized at the company and industry level for apples-to-apples comparisons – goes beyond headline financial metrics, with an average of over 160 financial line items and operational KPIs per company. Our data also benefits from high broker source counts, regular updates with each new model received from the sell side, and insight into the full calculation logic and audit trails for each individual line item, ensuring maximum data quality and freshness that you can trust. In addition, Visible Alpha includes insight into analyst trends and dispersions, as well as features such as the Revisions Analysis, Surprise Analysis, Target Price & Ratings, Industry Analysis, and Valuations pages.
In the fast-paced world of finance, time is both your most valuable asset and your greatest adversary. The ability to make timely, informed decisions and spot market opportunities can make or break your success.

Example: Imagine analyzing the technology sector and trying to assess the competitive landscape. Visible Alpha Insights offers you access to both consensus estimates and historical actuals that span several years, giving you the ability to analyze a given technology company’s financial performance and key operational metrics over time. Our Industry Analysis feature then enables you to compare these same metrics across multiple industry peers at the same time, giving you greater insight into the technology sector as a whole. With just a few clicks, you can quickly and easily explore the market, uncover emerging trends, and identify potential investment opportunities that others may overlook.

We understand the value of your time and need for streamlined research and optimized data. Visible Alpha Insights empowers you with precision, freshness, and interactivity, freeing you from tedious and time-consuming research and modeling workflows. With data sourced directly from the analyst models of over 200 broking firms, we handle the heavy lifting of ingesting, analyzing, and normalizing consensus data across the companies and industries that matter to you, so you can devote more of your time and energy to identifying advantageous market opportunities.

Visible Alpha disrupts the traditional paradigm by harnessing advanced technology and a cutting-edge data platform. Through our robust solution, we automate the labor-intensive tasks associated with creating consensus estimates, bringing efficiency and automation to the aggregation and analysis of data. This streamlined approach saves valuable time and resources, empowering users with reliable and comprehensive consensus estimates and actuals.

How does Visible Alpha create market consensus?

We first process full working models from the sell side. This involves initially extracting all line items directly from the raw models, presented as each analyst models each line item. We then take this data–line item by line item–and map it to be comparable for each company, including segment-level data, key company drivers, and YoY growth. Lastly, we also make the data comparable across an entire industry, including all financial and operating metrics for easy relative analysis of industry peers. Throughout this process, we apply machine learning and leverage our in-house industry experts to enable detailed, like-for-like comparisons across different analysts’ estimates.

Upon processing a number of analyst models for a given company, we create detailed consensus models across all of that company’s products, segments, geographies, and business drivers. Once the consensus models are uploaded to our platform, we then quickly and continually update any consensus estimates with every new analyst model and revision received. This provides you with a normalized view of all the relevant metrics and key drivers in a clean, comparable consensus model. Most importantly, we tackle the heavy lifting head-on to save you time and ensure the most accurate and timely consensus possible.

01 VA Raw Data to Powerful Insights

Let’s use Apple (AAPL) as an example. Many analysts covering Apple forecast net sales for the Apple Watch:

02 VA Raw Data to Powerful Insights

By adding all of these estimates together and taking the mean, we find that the FY 2023 consensus estimate for Apple Watch net sales is $19,556.2 million. While the consensus estimates may project a certain level of net sales for Apple Watch, it’s important to recognize that the spread of forecasts from the analyst community holds the true potential for identifying untapped growth opportunities. By exploring the range of forecasts and uncovering the outliers, Visible Alpha enables you to see the real market potential that consensus alone fails to reveal.


With Visible Alpha Insights, you can access consensus estimates with ease, unlocking the power of market insights and gaining a competitive edge. Our advanced technology eliminates the need for cumbersome manual processes, allowing you to make faster, more informed decisions with confidence.

What Are Consensus Estimates?

Consensus estimates are critical in financial analysis, representing a collective forecast by equity analysts of a public company’s future earnings. These estimates, often focusing on earnings per share (EPS) and revenue, provide a synthesized view from diverse analysts for different time frames, including quarterly, fiscal year, and beyond. They play a pivotal role in setting expectations in the financial market, offering investors and analysts a baseline for company performance evaluations.

Far from being simple predictions, consensus estimates embody the collective insight and foresight of financial experts, reflecting a blend of analytical rigor and market sentiment. This article will explore how these estimates are formulated, their critical role in investment decisions, and the broader impact they have on the financial landscape.

The Foundation of Consensus Estimates

Consensus estimates are derived from the aggregate forecasts of multiple analysts covering a stock. These forecasts include predictions for earnings per share (EPS) and revenue over various time frames. The size and scope of the company, along with the number of analysts contributing, define the depth and breadth of the consensus.

The Practical Application: A Real-World Example

In a real-world instance, Nvidia’s Q3 2024 results offer a clear example of consensus estimates’ impact. They reported revenues of $18.1 billion, surpassing the predicted consensus estimate from covering analysts of $16.2 billion.

In this context of Nvidia’s Q3 2024 results, it’s crucial to highlight that consensus estimates are utilized by a broad spectrum of financial stakeholders, including financial analysts, fund managers, and corporate executives. These groups rely on consensus estimates to gauge a company’s performance relative to market expectations, informing investment decisions and strategy adjustments. Nvidia’s significant revenue beat not only showcased its strong performance but also illustrated the critical role consensus estimates play in setting those market expectations. Understanding this, we can see that consensus estimates serve as a benchmark for evaluating corporate success, influencing investment choices and market sentiments. This example underscores why accurate consensus forecasting is essential for all market participants looking to make informed decisions in a dynamic financial environment.

For a detailed analysis, please refer to Visible Alpha’s report on Nvidia’s Q3 2024 earnings here.

Consensus Estimates and Market Dynamics

These estimates are not just numbers; they reflect the complex interplay of market expectations, company performance, and investor sentiment. Their accuracy and reliability can influence market efficiency and investor trust. For instance, when a company consistently misses or beats consensus estimates, it can have profound implications. A beat can enhance investor confidence, potentially driving up the stock price as the market reacts to the positive surprise, indicating the company’s performance is exceeding expectations. Conversely, consistent misses may erode trust, suggesting potential operational or financial challenges, leading to decreased stock value. Both scenarios highlight the significance of consensus estimates in shaping investor behavior and market dynamics, as they adjust their investment strategies based on these outcomes.


consensus cta 2

The Analytical Approach: Beyond Numbers

When analysts create consensus estimates, they employ various financial models to forecast a company’s future performance. This process involves estimating key financial metrics, such as earnings per share (EPS) and revenue, by analyzing and projecting the company’s future cash flows and other financial activities. Among these models, the Discounted Cash Flow (DCF) model is commonly used for its focus on evaluating a company’s valuation by projecting future cash flows and discounting them to their present value. This is part of a broader analytical effort to predict how well a company will perform financially in the future. Other methods also play crucial roles, for instance:

  1. Comparables Analysis (Comps): Analysts often use this technique to value a company by comparing it to similar companies in the same industry. For example, evaluating a retail company’s value by comparing it to its peers based on metrics like price-to-earnings (P/E) ratio.
  2. Precedent Transactions: This method involves analyzing the prices paid for similar companies in the past. It’s particularly useful in mergers and acquisitions. For instance, determining the value of a tech startup by looking at recent acquisition prices of similar startups.
  3. Leveraged Buyout (LBO) Model: Used primarily in private equity and investment banking, this model assesses the potential return on investment when a company is bought using a significant amount of borrowed money. For example, projecting the returns of a leveraged buyout deal for a manufacturing firm.

Each of these methods contributes a different perspective, enriching the overall analysis and helping to shape a more nuanced consensus estimate. By incorporating these diverse techniques, analysts can provide a more comprehensive view of a company’s financial prospects.

Consensus estimates are crucial in understanding a company’s financial future. Though highly informative, they are not perfect and should be viewed as part of a broader analytical context that includes market trends and specific company factors. With this comprehensive guide, investors and analysts are better equipped to interpret these estimates, enhancing their ability to make informed decisions in the financial markets.

For investor relations (IR) teams, maintaining constructive relationships with investment banking and independent research analysts is critical. A significant facet of this collaborative association are the projections from sell-side broker analysts regarding a company’s future performance, meticulously recorded in their spreadsheet models. The aggregation of these models provides a quantifiable market perspective of the company, offering a wealth of insights for IR teams on how the investment community views the company.

The market’s view of a company’s business drivers

Traditional consensus metrics mostly focus on outcomes like revenue, net income, and earnings per share (EPS). A more detailed examination of the analysts’ models and the detailed forecasts contained in them, however, unveils a comprehensive understanding of how analysts believe those outcomes will be achieved. The resulting data reveals the driving forces behind the business, providing an invaluable market perspective that a company and its IR team can use for future planning and investor communications.

Harnessing analyst models and consensus data

Analyst model forecasts significantly influence market sentiment and shape investors’ perceptions of a company. Given the vast array of investible opportunities, institutional investors often rely heavily on sell-side research. According to Visible Alpha’s founder and Chief Research and Innovation Officer, Scott Rosen: “Investors look at sell-side analysis and forecasts because no other source is as broad and deep for providing thoughtful and detailed analysis of a company.”

Data consolidating the viewpoints of the sell-side analyst community empowers IR teams to grasp the information environment of their investors better, facilitating improved anticipation of potential investor reactions.

Tracking the evolution of these expectations in comparison to the company’s own projections and guidance equips IR teams to adjust communication strategies, engage in meaningful dialogues with sell-side analysts, identify investor concerns for internal discussions, and benchmark the company against industry peers.

Assessing the spectrum of analysts’ perspectives

Determining the critical investment questions that analysts and investors have about a company is a straightforward task for IR teams. However, quantifying these investment controversies is more challenging. Analyzing the range of analyst views on key line items – unit volume growth of a new product, net impact of cost reduction, maintenance of margins for major product lines, etc. – can provide precise measurements of market expectations and the level of uncertainty surrounding the company’s most important performance metrics.

“The consensus is just the mean, a statistic that roughly summarizes a variety of different expectations. This can often be less interesting and useful than knowing the range of forecasts. Sometimes there is very tight agreement and sometimes a widely divergent spectrum of views,” explains Rosen.

A broad spread of forecasts on a key business driver could signal the need for more transparency or improved guidance on the part of the company to clarify a point of confusion, or could reflect significant differences in analyst opinions on a fundamental issue. This information enables IR teams to proactively address concerns with specific analysts and to quantify any investment controversies that may drive investor behavior.

A broad spread of forecasts on a key business driver could signal the need for more transparency or improved guidance on the part of the company to clarify a point of confusion, or could reflect significant differences in analyst opinions on a fundamental issue. This information enables IR teams to proactively address concerns with specific analysts and to quantify any investment controversies that may drive investor behavior.

The importance of timely responses

For an IR team, accurately tracking critical changes in key forecasts can be a herculean task, considering the ever-increasing size and complexity of analyst models and the frequency of revisions. Analysis of Visible Alpha’s data indicates that the average number of consensus line items per company was 161, with a high well above 1,500. Each of those line items experience an average of 14 revisions per company during a quarter, with some seeing more than 100.

The repercussions of delays in tracking these changes could severely hinder an IR team’s ability to respond effectively. This underlines the importance of receiving timely and detailed insights to maintain an agile approach.

Beyond earnings: An ongoing process

According to a Visible Alpha study, while a significant percentage of analyst revisions (32%) occur within a day of an earnings announcement, the flow of information from analysts continues during the rest of the quarter. Almost 50% of analyst revisions are made between two weeks after earnings and two weeks before the next reporting.

Using Consensus to Better Manage Expectations of the Investment Community

Using Consensus to Better Manage Expectations of the Investment Community

This study underscores the substantial value for IR teams in keeping a constant finger on the pulse of ongoing analyst updates. Real-time consumption of sell-side models and forecasts provides an invaluable tool for staying ahead of the curve. Outdated snapshots of analyst sentiment, or high-level forecasts that do not illuminate the market’s changing view of their company’s key drivers, cannot serve the interests of IR teams in a constantly evolving information landscape.

The bottom line: Timely and comprehensive insights

Having timely access to comprehensive sell-side analyst models, forecasts, and market consensus can equip IR teams with invaluable insights. These insights may not only inform internal business strategy, but also foster effective external communications with analysts and investors. For investor relations, managing expectations through the strategic use of consensus can offer a robust competitive advantage, fostering stronger relationships and facilitating more informed decision-making.


This article was originally published in the Informed edition 119 – Summer 2023 by the IR Society.