Visible Alpha Insights
Granular Consensus and Broker Estimates for Investment Research
Quickly understand the market’s view on a company or industry and easily conduct relative analysis to extract actionable insights from sell-side models.

Quickly understand the market’s view on a company or industry and easily conduct relative analysis to extract actionable insights from sell-side models.

250+ brokers contributing models, which translates to coverage on 7,000+ companies globally.
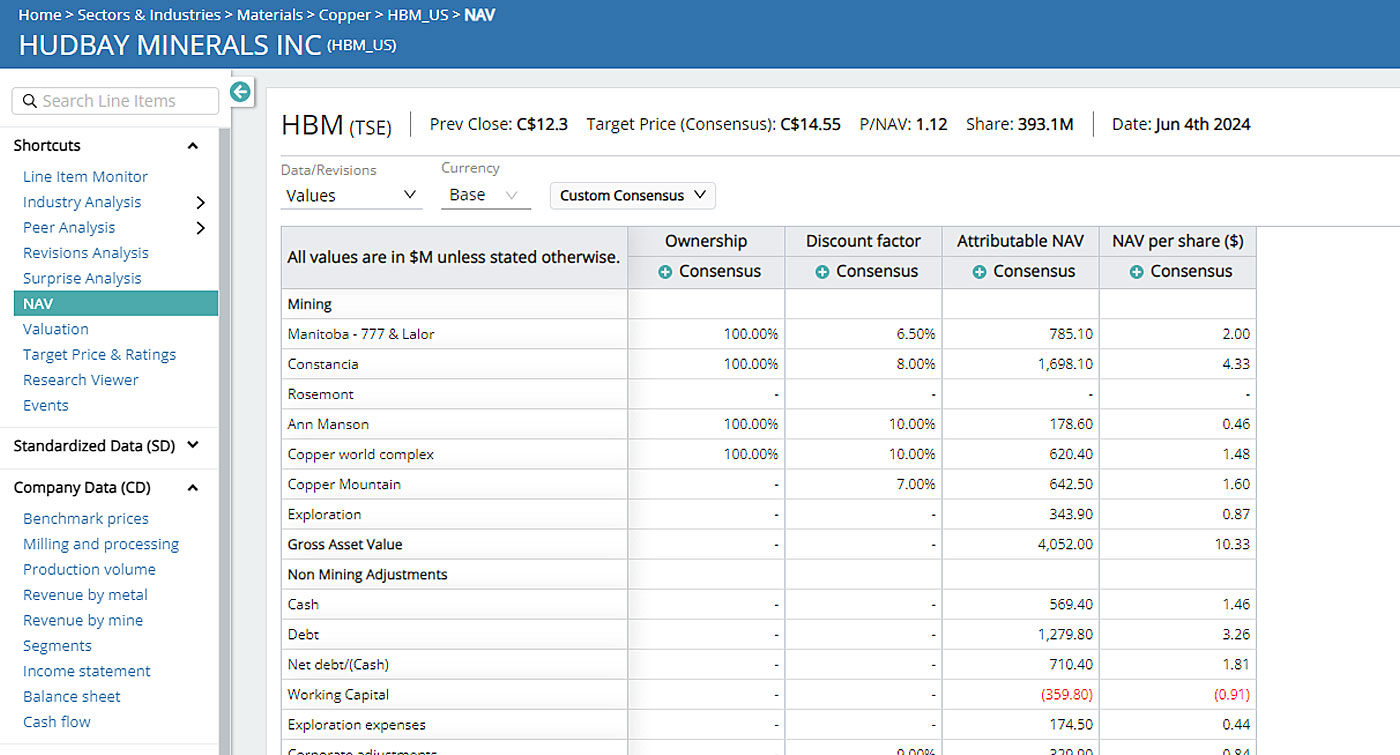
Visible Alpha obtains raw sell-side models – not reports – providing headline numbers and insights into all the line items analysts generate.
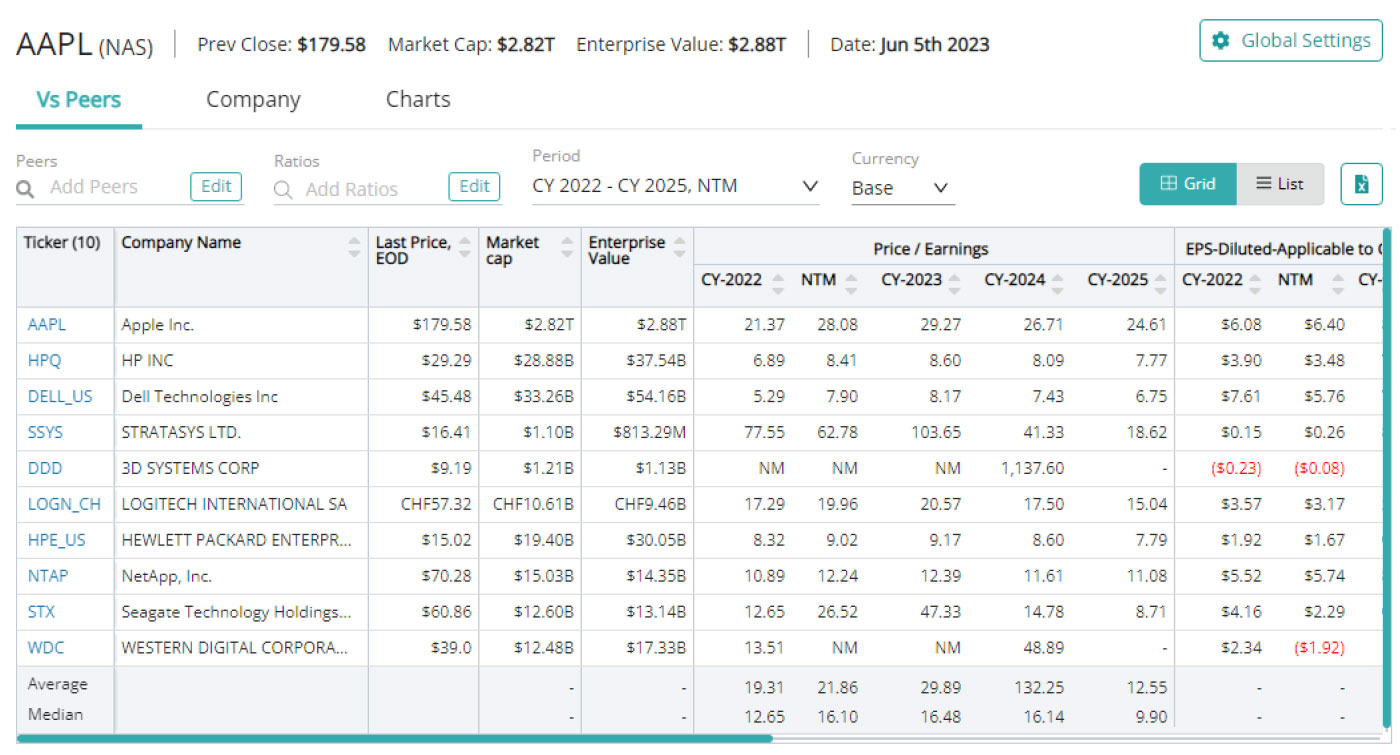
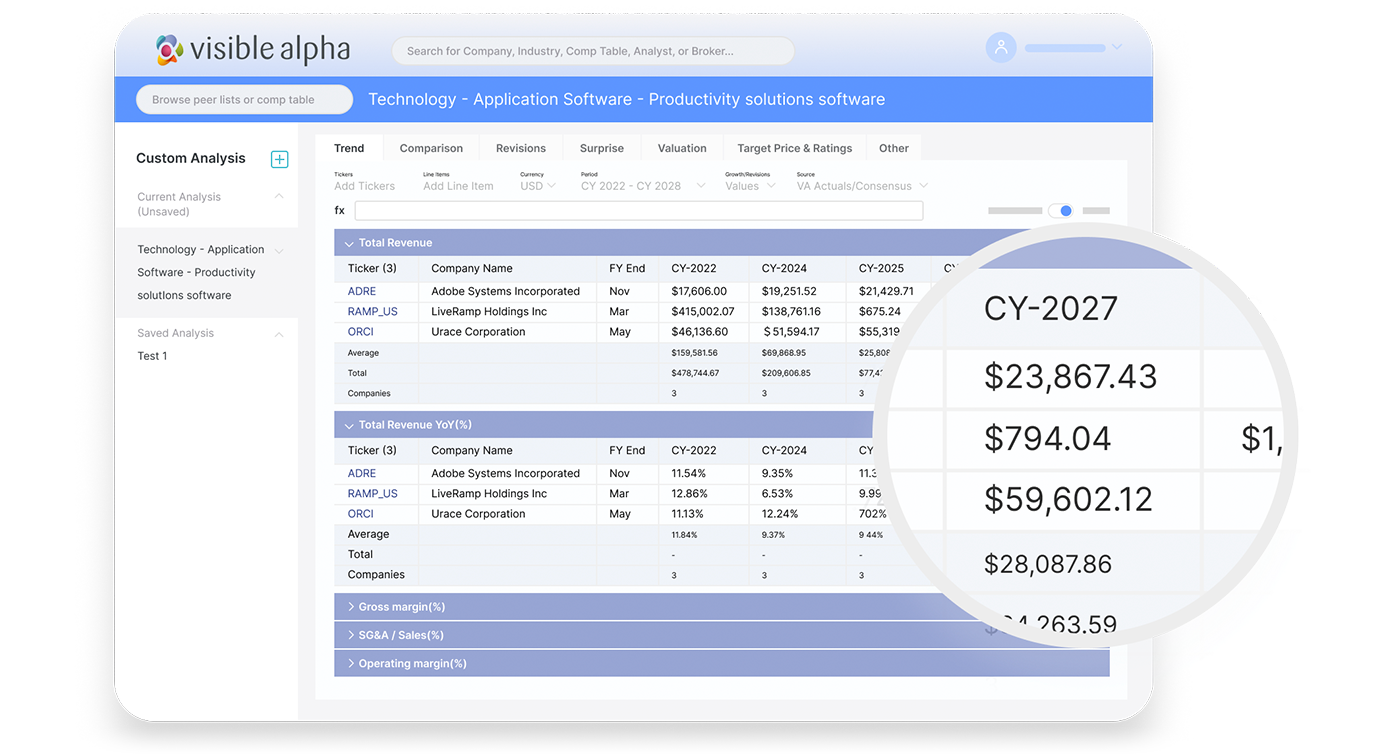
Leverage visualization tools and comp tables so you can quickly analyze anomalies and identify key sources of alpha.
Visible Alpha aggregates and standardizes financial data, allowing unprecedented granularity when benchmarking KPIs through peer analysis.
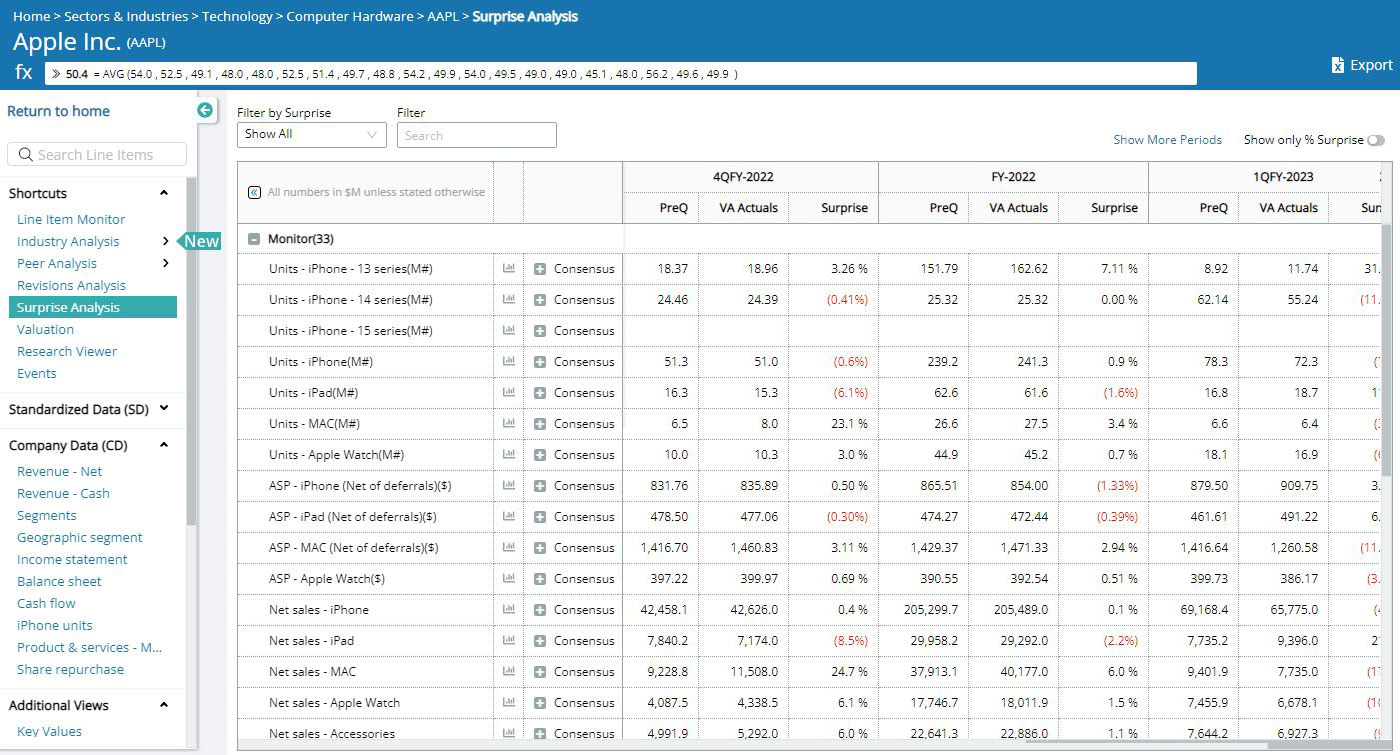
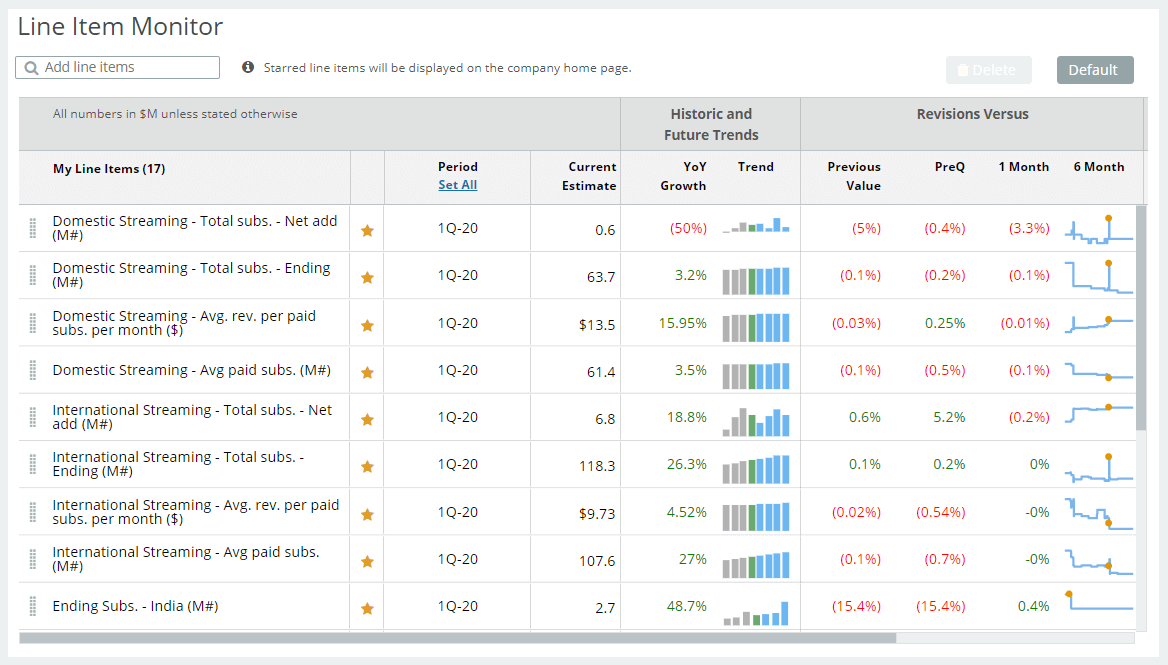
Understand how unreported metrics are driving consensus with VA Actuals, a proprietary data set that supplements historical data from filings with crowd-sourced estimates.
No matter your role in the world of finance, Visible Alpha Insights is your key to unlocking a world of possibilities. Discover how our powerful tools can transform the way you work, enabling smarter, data-driven decisions that drive success.
We provide the market’s view to enable you to extract valuable insights and gain an investment edge. To do that, we provide multiple ways for you to access and incorporate our data directly into your workflow.
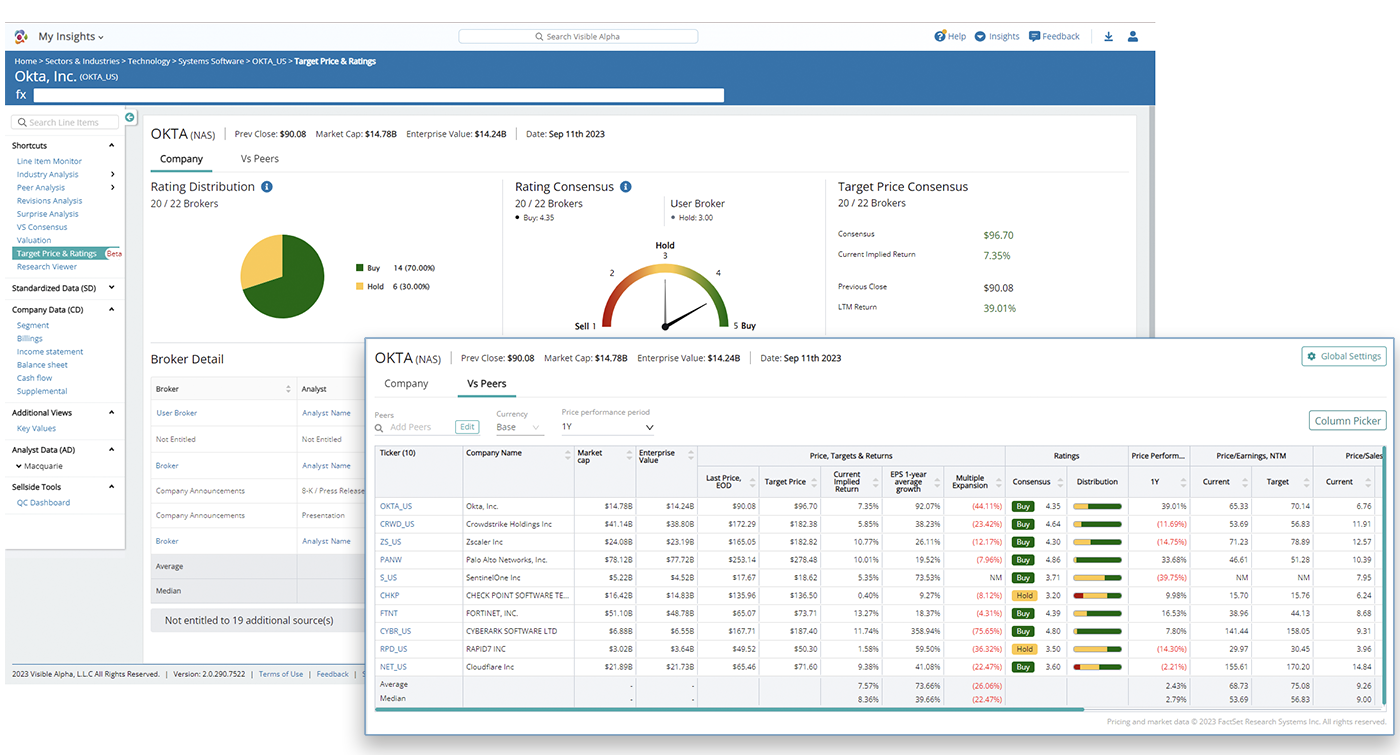
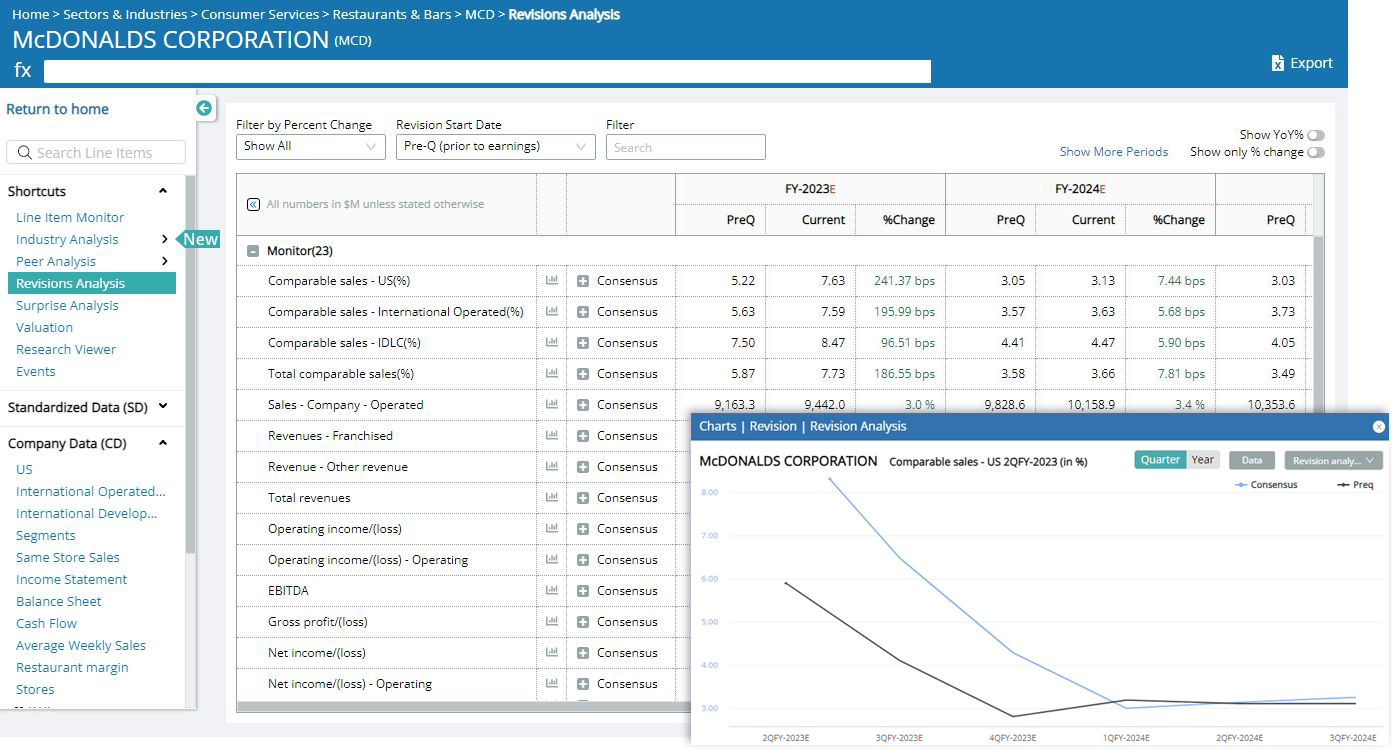
Our web-based interface includes data visualizations, comp tables, alerts and direct downloads of raw analyst and consensus models. We offer charting tools to enable you to discover analyst outliers and view growth trends over time on any line item, as well as a suite of visualization and analytics tools to quickly view revisions, surprises and dispersions.
With robust charting, visualization and analytics tools, you can extract more valuable insights from analyst estimates and consensus forecasts. Instantly discover analyst outliers, identify trends, visualize analyst revisions and compare broker estimates for each granular line item.

Where is the data sourced?
Our data is sourced directly from sell-side analyst models through our partnerships with brokers across the world. By contributing their spreadsheet models to Visible Alpha Insights, this enables us to capture every detailed line item analysts forecast in their coverage universe. For a full list of brokers, click here >
How do you create consensus?
We process full working models from the sell side; apply machine learning to extract all of the assumptions buried deep within analyst models; create detailed consensus models across all of a company’s products, segments, geographies and business drivers; and continually update consensus with every new analyst model and revision received. This provides you with a normalized view of all the relevant metrics and key drivers in a clean, comparable consensus model.
How is Visible Alpha different from other consensus estimates providers?
Our unique relationships with brokers gives us access to their analysts’ full working models. While traditional consensus providers offer limited line items and forecast periods, Visible Alpha Insights has more consensus data on crucial line items, with higher source count and quality.
Does Visible Alpha add new companies to the platform?
We are continually adding new companies across the globe to the platform. Users can request coverage on any company from within the platform.
Does Visible Alpha ever onboard new brokers onto the platform?
We are always increasing coverage with new and current brokers. If a broker you work with is not contributing to our platform, we will work with you to onboard their content. If you are a broker who would like to start contributing content to Visible Alpha, please contact us.
Who uses Visible Alpha Insights?
Hedge funds, asset managers, corporations, investment banks, equity research departments, quantitative funds, independent research providers, private equity, wealth managers, family offices, academia and media outlets.