The Visible Alpha AI Monitor: Measuring AI Growth and Its Impact
By: Melissa Otto, CFA
The Visible Alpha AI Monitor aggregates publicly-traded U.S. technology companies, providing a comprehensive measure of the current state and projected growth of the core AI industry. This encompasses the AI-exposed revenues for companies that are building AI infrastructure and capabilities for both enterprises and consumers.
Investors may use the Visible Alpha AI Monitor to generate new ideas to capture growth emanating from the core AI industry, as well as to evaluate the potential AI exposure of technology stocks in their existing portfolios.
We have identified specific line items that capture potential growth of AI-related revenues that are available in the Visible Alpha Insights platform (see the goals, objectives, and methodology of the AI Monitor at the bottom of this page).
Key Takeaways
|
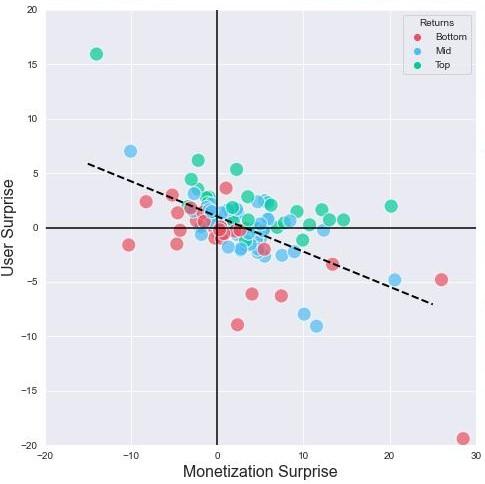
Figure 1: AI growth and performance overview
Source: Visible Alpha consensus (December 12, 2023). Stock price data courtesy of FactSet. Current stock prices are as of the market close on December 11, 2023. TOP 10 = IBM, Qualcomm, Oracle, Microsoft, Intel, Amazon, Adobe, Dell, Nvidia, Google. These firms currently have the largest revenue-generating segments geared to AI.
Current AI Landscape
At the moment, there is an arms race to convert data centers to accelerated computing to support AI and machine learning. As a result of the unexpectedly strong demand this year from cloud service providers, Nvidia (NASDAQ: NVDA) has seen the sum of its estimates over the next three years increase an astonishing $155 billion since January 2023. Meanwhile, the aggregate of the other nine largest AI-exposed revenue generators is expected to decline over $75 billion, driven by downward revisions to the revenue outlooks for AWS, Google Cloud, Azure IaaS/PaaS, and Qualcomm. Given the magnitude of Nvidia’s projected increases, is the growth in this part of the stack now priced in? As we move up the stack, what companies may begin to see their revenue explode, like Nvidia has, or possibly implode as AI takes hold?
Nvidia has been dominating the AI landscape, which has led it to drive the AI-exposed revenue outlook for the 10 largest AI-exposed revenue generators and the overall Visible Alpha AI Monitor. However, large and small companies have been investing in AI. Will these investments impact the broader industry and create opportunities for a wider array of firms to grow their AI revenues and emerge as new leaders? Which companies will be the winners and which ones may see their business models and profits decline?
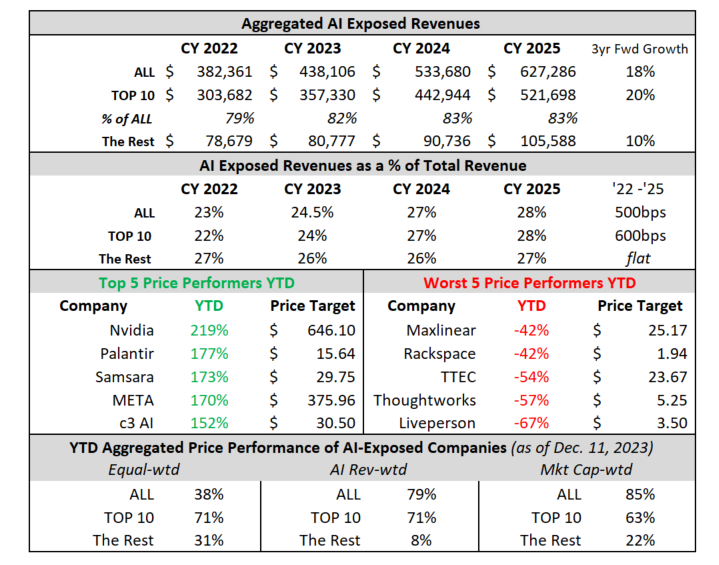
Figure 2: Top 10 breakdown of AI-exposed revenue expectations

Source: Visible Alpha consensus (December 12, 2023). TOP 10 = IBM, Qualcomm, Oracle, Microsoft, Intel, Amazon, Adobe, Dell, Nvidia, Google. These firms currently have the largest revenue-generating segments geared to AI. Based on higher analyst counts, we are using the non-GAAP revenue number for Oracle and Ansys.
Performance Summary
Currently, the Visible Alpha AI Monitor universe of 62 publicly-traded U.S. companies is 82% weighted to the 10 largest companies, with the remaining 18% dispersed among 52 companies.
On a market-cap weighted and AI-exposed-revenue weighted basis, the Visible Alpha AI Monitor was driven by substantial stock price outperformance (vs. the S&P 500 index) of the largest companies this year. In addition, the smaller companies were meaningful underperformers (vs. the S&P 500 index), especially on an AI-exposed-revenue weighting.
On an equal-weighted basis, the AI Monitor would have generated significantly lower return when compared to the market-cap and AI-exposed-revenue weighted aggregations this year, driven by the drag of a lower return generated by the 52 remaining names. Stock selection was an important dimension among the 52 names, as more than 50% of the companies underperformed the index.
Top 10
Based on an analysis of the 10 largest players from January of this year, 2025 revenue forecasts for AI-exposed revenue segments increased $40 billion in total. However, $70 billion of that is from Nvidia, which means that the rest of the Top 10 saw revenue estimates decline almost $30 billion in aggregate. This was driven by lower expectations for AWS, Google Cloud, and Qualcomm QCT. However, though expectations came down for these companies, stock performance was strong for eight of the Top 10 companies, the exceptions being Qualcomm and IBM, both of which appear to have lower AI-exposed revenue.
The Rest (smaller contributors)
The remaining list of 52 companies may serve as a good place for investors to discover new ideas by surfacing expanding new players. While smaller companies in aggregate have not performed as well as the Top 10, there have been some clear outperformers relative to others.
Among the smaller firms, revenue growth expectations are very mixed. Strong double-digit revenue growth is expected at some firms, while others are seeing estimates decline. These dynamics may help investors identify emerging trends in the space. We have already seen that to be true this year with Palantir, C3 AI, Samsara, and MongoDB delivering very strong outperformance (vs. the S&P 500 index), while more than half of the smaller companies in the AI Monitor substantially underperformed the index. Rackspace, TTEC, Thoughtworks, and Liveperson fell by more than 50%.
The role of Nvidia
The magnitude of growth baked into Nvidia, combined with this year’s over 200% stock performance, has been absolutely staggering. Looking further out to the end of 2027, Visible Alpha consensus for Nvidia revenue has exploded by nearly $100 billion from a modest $33 billion in January to now a whopping $129 billion currently projected in Data Center revenues alone.
Nvidia has driven the total AI Monitor and the Top 10 companies, as analysts began to anticipate enormous growth to come from transitioning data centers to accelerated computing to support AI. Nvidia made up 30% of the 85% aggregated market-cap weighted stock performance of the Visible Alpha AI Monitor. Looking at only the Top 10 market-cap weighted stock performance, Nvidia was close to 40% of the 65% aggregated return. Given the strength of both the revisions to future growth and the stock performance that followed, to what extent has the strength in Nvidia’s fundamentals already been priced in?
Figure 3: Nvidia’s Data Center revenue estimates and revisions
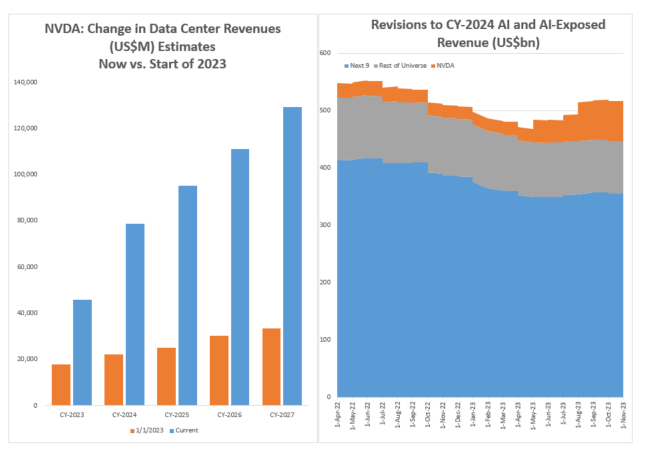
Source: Visible Alpha consensus (December 12, 2023)
Figure 4: AI Monitor detailed breakdown
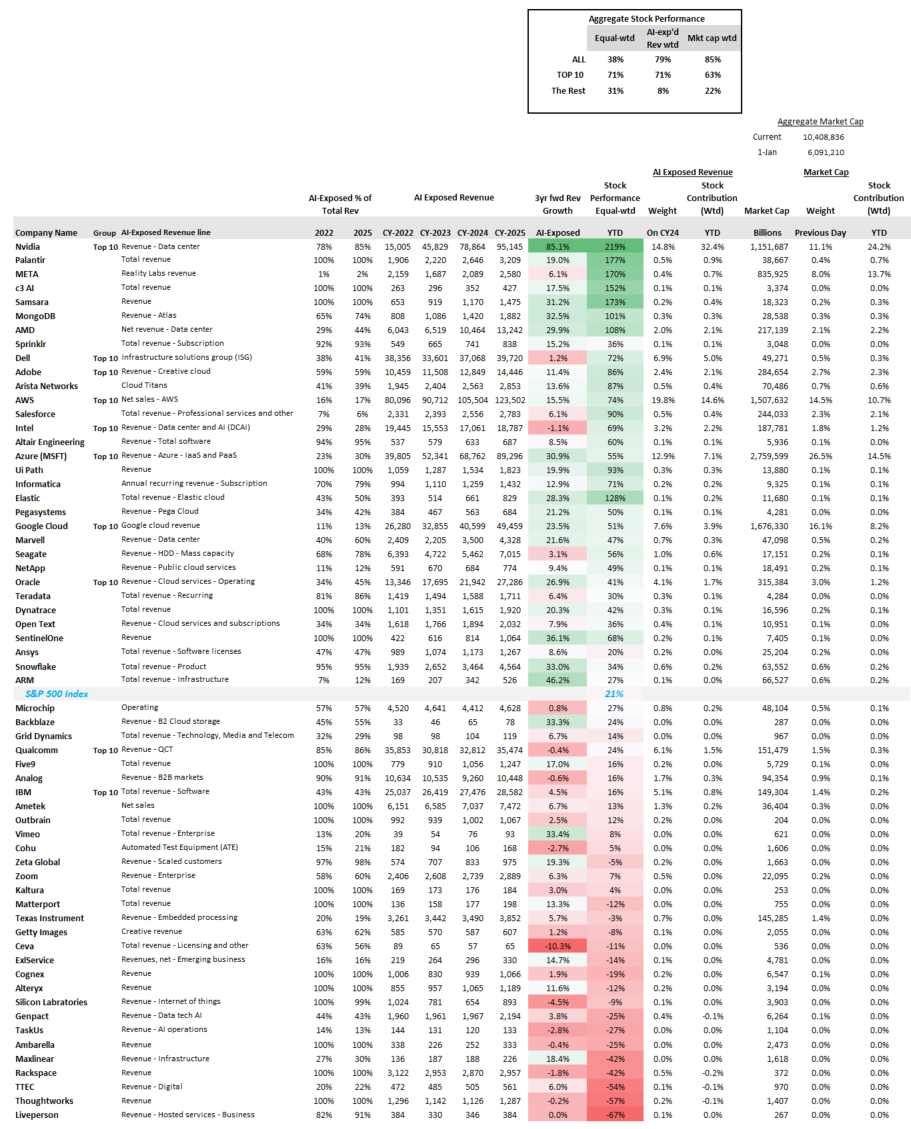
Source: Visible Alpha consensus (December 12, 2023). TOP 10 = IBM, Qualcomm, Oracle, Microsoft, Intel, Amazon, Adobe, Dell, Nvidia, Google. These firms currently have the largest revenue-generating segments geared to AI. Based on higher analyst counts, we are using the non-GAAP revenue number for Oracle and Ansys.
Final Thoughts
While this year has clearly been the Year of Nvidia, Palantir and C3 AI have seen their exposure to AI translate into meaningful stock outperformance relative to the S&P 500 index. However, for many firms it is not clear how AI-exposure will impact business models.
For example, Meta Platforms is investing in AI and has seen its stock rise 170% in 2023, but it is not clear how their AI strategy will show up in their numbers and at what pace. On a three-year forward basis, Meta’s AI-exposed revenue growth, as seems to be reflected in Reality Labs, is only expected to be 6%, but it’s obscured by the other businesses in this segment.
There are numerous such examples where the AI-exposed revenue growth projections and the stock performance do not appear correlated. As the AI story unfolds over the next few years, will the transparency of AI drivers improve and drive stock outperformance?
As 2023 comes to a close, will this year’s best performers, like Nvidia and Palantir, continue to drive the Visible Alpha AI Monitor in 2024 or will we see a rotation into less appreciated firms where the growth may not yet be priced in?
AI Monitor Goals and ObjectivesThe objective of the Visible Alpha AI Monitor is to show the investment community which companies are likely to drive AI going forward. As the world embraces AI and its applications to enterprise workflows and our daily lives, big questions exist about how AI’s impact on company business models will unfold over the next 3-5 years. AI can potentially free people from tedious work to enable more focus on critical workflows that require human creativity and analysis. A primary goal of the Visible Alpha AI Monitor is to show which U.S. companies and specific line items we are keeping an eye on as the embryonic AI theme emerges across company fundamentals and begins to scale broadly across the economy. We are monitoring how AI may be reflected in the numbers and which companies may be benefitting more or less. This universe attempts to be comprehensive and to show investors the dynamics of both the large and smaller U.S. players. Additionally, it aims to help investors identify new names that may be smaller and less covered, but potentially growing and emerging more quickly. AI Monitor MethodologyUsing Visible Alpha’s comprehensive database of detailed estimates pulled directly from sell-side analysts’ spreadsheet models, we have assembled an aggregation with an initial universe of 62 publicly-traded companies that are contributing to the infrastructure and broad scaling of AI capabilities. This monitor aims to provide a current and future snapshot as to where AI-related revenues are and are not growing across each of these 62 companies, and particularly the ten largest. We have aggregated the revenues of specific business segments at firms that are driving the wider AI trend. For larger firms, we have attempted to pinpoint where in their revenue model AI is driving growth. For some smaller firms, we are simply incorporating 100% of revenues. The AI-exposed revenue lines we identify are intended to be used as a proxy for monitoring the growth of each company’s AI business. Given both lack of discrete company disclosures and how intertwined AI and conventional technologies and services can be, these lines should not be taken as exact quantifications of AI revenues, but are, we believe, the best systematic approximation available. For Visible Alpha subscribers, details of these companies can all be found within the Visible Alpha Insights platform. Each company included in the monitor has coverage by at least four sell-side analysts. In addition, given the quickly evolving state of the AI space, these line items are subject to change and may shift significantly over time. We plan to refresh the data on an ongoing basis and provide regular updates. |