Financials Archives - Visible Alpha

Visible Alpha Financials

Looking at the direction of Visible Alpha consensus pre and post earnings season of the thirty companies in the Dow Jones Industrial Average (DJIA), the data points to the potential for further surprises. The macroeconomic and company-specific challenges vary significantly by company. With greater clarity emerging around tariffs and trade issues, markets are reaching new highs. Despite persistent inflation and a softening US dollar in 2025, companies seem to be navigating the challenges. While the full impact of tariffs and trade on the macro environment remains an open question, many companies currently show a stable earnings outlook, which may or may not be the case going into the second half of the year.

United Healthcare is down 40% year-to-date and the worst performer in the index, likely due to the tragedy involving its former CEO and the significant downward revisions, especially to its profitability. The company presents perhaps the most idiosyncratic downside risk. In addition to weakness at UnitedHealth Group (NYSE: UNH), Merck & Co. (NYSE: MRK), Apple (NASDAQ: AAPL), Salesforce (NYSE: CRM), and Nike (NYSE: NKE) have also weighed on the DJIA, due to concerns about the outlook for key areas of these companies.

Apple and Nike are two examples of companies impacted by China exposure, but with different expectations. Apple’s exposure to both China’s end market and supply chain has created headwinds for its fundamentals. The overall expectation for iPhone continues to move lower, as the upgrade cycle continues to get pushed out in the US. This combination poses a particular challenge to its outlook for the second half of the year. In contrast to Apple, Nike’s outlook beat expectations. Nike was the last to report and surprised the market on June 26, 2025, by delivering an earnings outlook that gave gross margin weakness that was not as bad as expected. Nike’s outlook seemed to be the catalyst that has driven the stock up over 20% on June 27, 2025, offsetting its previous negative contribution. China continues to be an open long-term question for both the company’s manufacturing and growth.

While trade and tariffs have been a headwind, the AI technology theme has helped the DJIA. Microsoft (NASDAQ: MSFT), NVIDIA (NASDAQ: NVDA), and IBM (NYSE: IBM) are outperformers benefiting from the company’s specific strategies around AI. Nvidia’s fundamentals have been moving around on debates around its new Blackwell solution and the magnitude of growth going forward. Microsoft and IBM have seen clear upward revisions to earnings drivers and their growth outlooks. However, all three seem to signal that the AI trend is supporting company fundamentals.

One area that is a wildcard is consumer discretionary. Walmart (NYSE: WMT), Home Depot (NYSE: HD), Walt Disney Co. (NYSE: DIS), and Amazon (NASDAQ: AMZN) have seen some downward pressure on retail sales forecasts. Their ability to cut costs seems to support their earnings stability. However, if consumption starts to slow more significantly, this may impact top-line growth further, which may cause estimates to come down more. We are watching the estimates at these companies carefully.

As the market moves into the second half of the year, the performance of the overall macro backdrop in the US is likely to be a key factor in determining when the Fed may cut interest rates. Given the significant amount of volatility in markets this year, trading volumes are up, which seems to support the strength of JPMorgan Chase (NYSE: JPM) and Goldman Sachs (NYSE: GS). In the meantime, the awkward combination of inflation, slower growth and a weakening US dollar make the environment particularly tricky.

063025 CV PostEarningsConsensus 33

The tables below provide a snapshot of how analyst expectations have shifted pre- and post-earnings across the DJIA constituents, highlighting where issues impacting company fundamentals —positive or negative—have reshaped the outlook.

062425 CV ConsensusEstimates 1

063025 CV PostEarningsConsensus 1

062425 CV ConsensusEstimates 2 063025 CV PostEarningsConsensus 2

amgen 1

amgen 2

Apple 1

Apple 2

Boeing 1

Boeing 2

Caterpillar 1

Caterpillar 2

Chevron 1

Chevron 2

Cisco 1

Cisco 2

Coca Cola 1

Coca Cola 2

Disney 1

Disney 2

Goldman Sachs 1

Goldman Sachs 2

Home Depot 1

Home Depot 2

Honeywell 1

Honeywell 2

IBM 1

IBM 2

Johnson & Johnson 1

Johnson & Johnson 2

JP Morgan 1

JP Morgan 2

McDonalds 1

McDonalds 2

Merck 1

Merck 2

3M 1

3M 2

Microsoft 1

Microsoft 2

Nike 1

Nike 2

Nvidia 1

Nvidia 2

P&G 1

P&G 2

Salesforce 1

Salesforce 2

Sherwin Williams 1

Sherwin Williams 2

The Travelers Companies 1

The Travelers Companies 2

United Health Insurance 1

United Health 2

Verizon 1

Verizon 2

Visa 1

Visa 2

Walmart 1

Walmart 2

Big Banks: A look at the key segments

Here is a look at the direction of estimates aggregated by the key capital markets segments for the bulge-bracket US investment banks: J.P. Morgan (NYSE: JPM), Goldman Sachs Group Inc. (NYSE: GS), Morgan Stanley (NYSE: MS), Citigroup Inc. (NYSE: C), and Bank of America Corp. (NYSE: BAC).

050925 ZU BigBanks 1

050925 ZU BigBanks 2

The mixed direction of expectations around these key business lines may reflect the current market sentiment around the macro environment.

  • Equity Underwriting and Advisory estimates show declines since the beginning of the year. Given the uncertainty around tariffs, the outlook has become more difficult for senior leaders to predict, likely putting deals and transactions on hold.
  • Debt Underwriting has been relatively stable. The stability of debt underwriting may indicate that there is an underlying stability in market conditions and the creditworthiness of borrowers.
  • Trading shows an uptick in estimates since last fall. The persistent macro uncertainty seems to have fueled volatility in the capital markets and increased trading activity which may be supporting an increase in expectations.

Key Takeaways

  • Rising interest rates have led to a shift in the demand for interest-earning deposits away from non-interest-earning accounts.
  • As a result, leading banks are projected to see their cost of funds track the increases in rates in 2023, before stabilizing starting in 2024.

Since March 2022, the U.S. Federal Reserve has hiked its benchmark rate 10 times and recently raised its target federal funds rate yet again to 5.25-5.5%. Although inflation in the U.S. has started to cool, it remains well above the Fed’s 2% target. Higher interest rates have made borrowing more expensive and saving more attractive to depositors. The desire to earn higher returns on savings is seeing depositors move away from non-interest-bearing accounts.

Here, we take a look at analysts’ expectations for the top five U.S. national banks: JPMorgan Chase (NYSE: JPM), Bank of America (NYSE: BAC), Wells Fargo (NYSE: WFC), Citigroup (NYSE: C), and PNC (NYSE: PNC). We also look at leading U.S. regional banks: KeyCorp (NYSE: KEY), Truist Financial (NYSE: TFC), Fifth Third Bancorp (NASDAQ: FITB), and Capital One Financial (NYSE: COF).

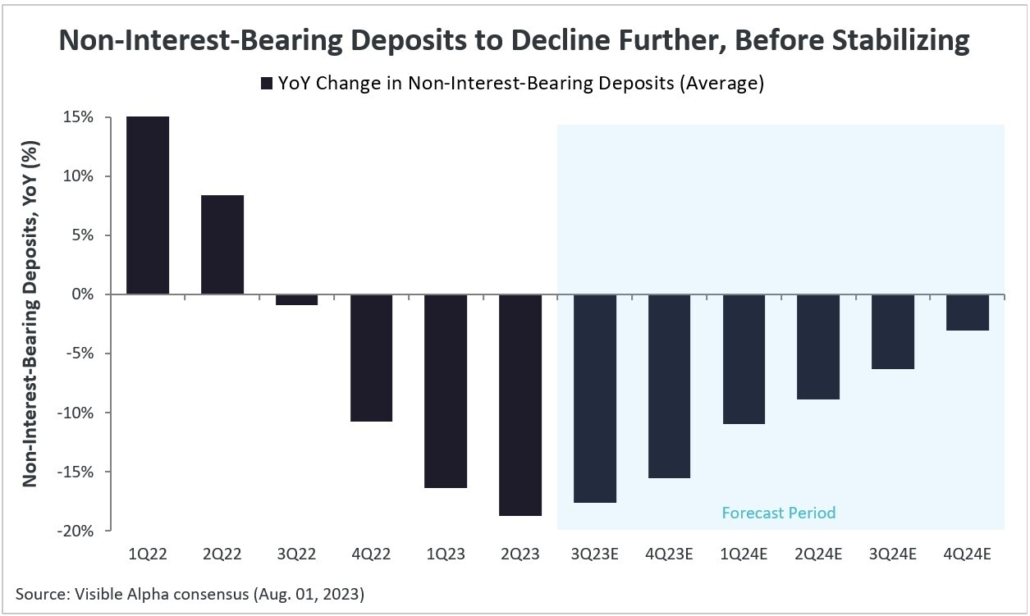
From recent earnings releases, the top five U.S. national banks saw non-interest-bearing deposits collectively decline by $108 billion in 2Q 2023. Analysts expect these deposits to continue to decline in the coming quarters, albeit less aggressively. Based on Visible Alpha consensus, non-interest-bearing deposits are collectively projected to decrease by 13% year-over-year for these banks in 2023.

Figure 1: YoY Change in Non-Interest-Bearing Deposits

YoY Change in Non-Interest-Bearing Deposits

Note: YoY growth calculated based on the quarterly aggregates of average non-interest-bearing deposits for JPMorgan Chase (NYSE: JPM), Bank of America (NYSE: BAC), Wells Fargo (NYSE: WFC), Citigroup (NYSE: C), PNC (NYSE: PNC), KeyCorp (NYSE: KEY), Truist Financial (NYSE: TFC), Fifth Third Bancorp (NASDAQ: FITB), and Capital One Financial (NYSE: COF).


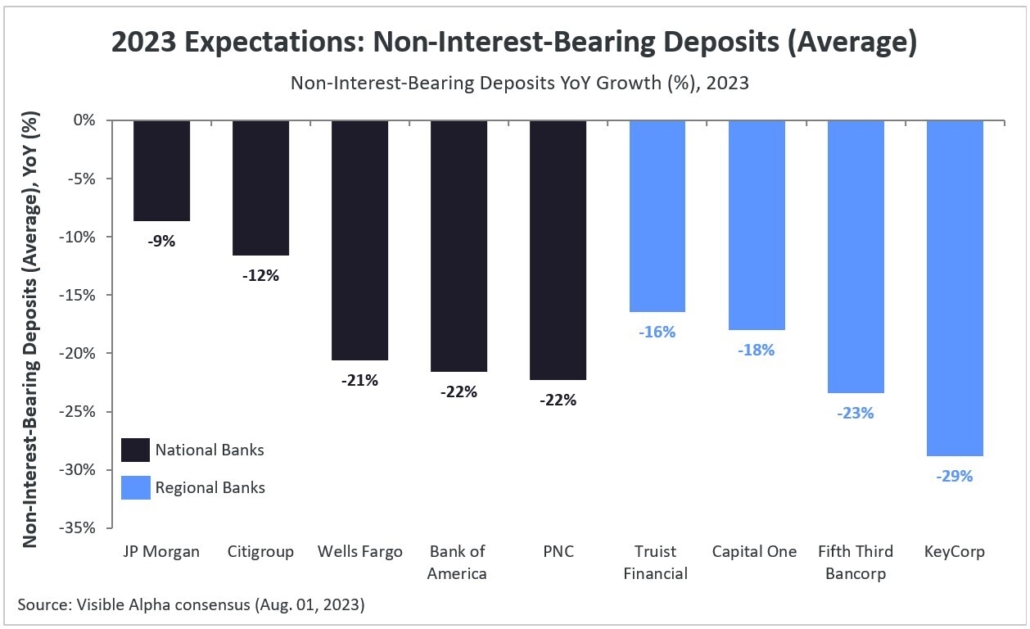
The chart below highlights analyst expectations for the average growth of non-interest-bearing deposits in 2023:

Figure 2: 2023 Expectations for Non-Interest-Bearing Deposits

2023 Expectations for Non-Interest-Bearing Deposits

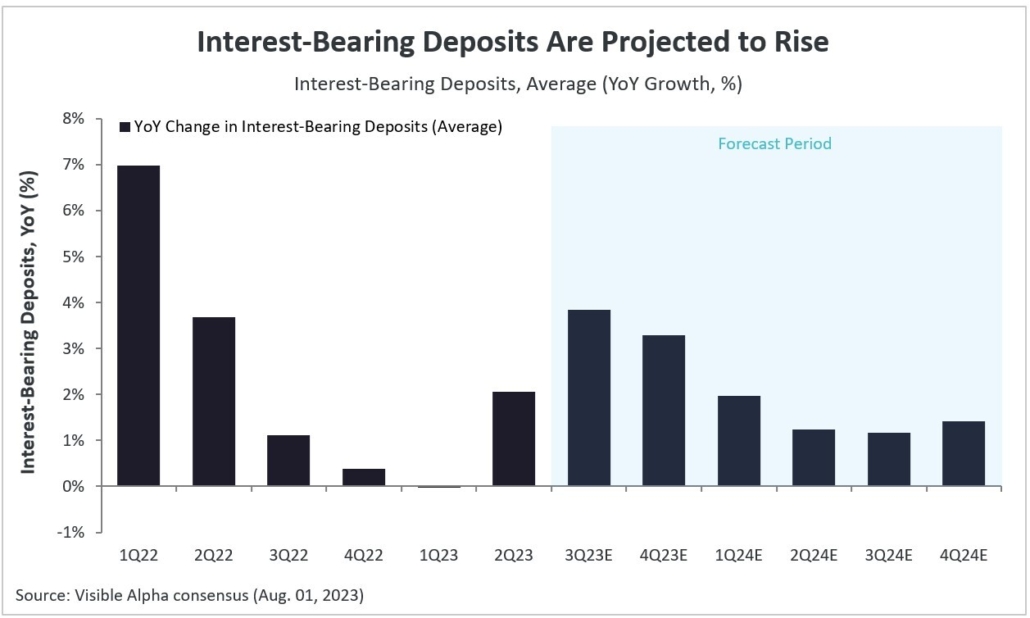
In contrast, interest-bearing deposits are seeing steady growth as institutional investors move their funds away from non-interest-bearing accounts towards those that offer higher yields. Average interest-bearing deposits collectively increased by $75 billion for the nine banks in 2Q 2023 from 1Q 2023.

Figure 3: YoY Change in Interest-Bearing Deposits

YoY Change in Interest-Bearing Deposits

Note: YoY growth calculated based on the quarterly aggregates of average interest-bearing deposits for JPMorgan Chase (NYSE: JPM), Bank of America (NYSE: BAC), Wells Fargo (NYSE: WFC), Citigroup (NYSE: C), PNC (NYSE: PNC), KeyCorp (NYSE: KEY), Truist Financial (NYSE: TFC), Fifth Third Bancorp (NASDAQ: FITB), and Capital One Financial (NYSE: COF).


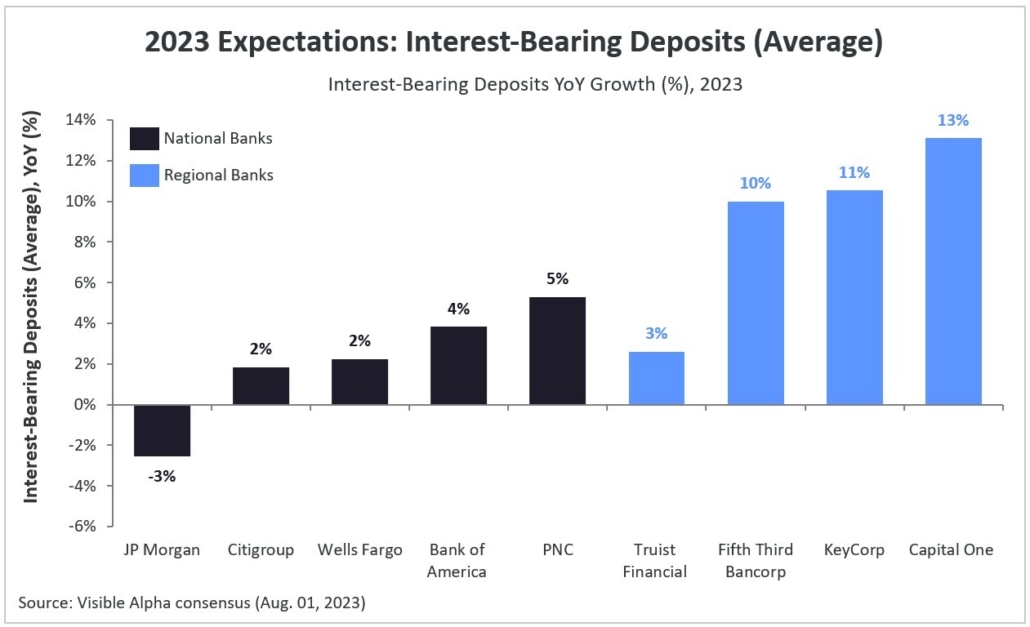
The chart below highlights analyst expectations for the average growth of interest-bearing deposits in 2023:

Figure 4: 2023 Expectations for Interest-Bearing Deposits

2023 Expectations for Interest-Bearing Deposits

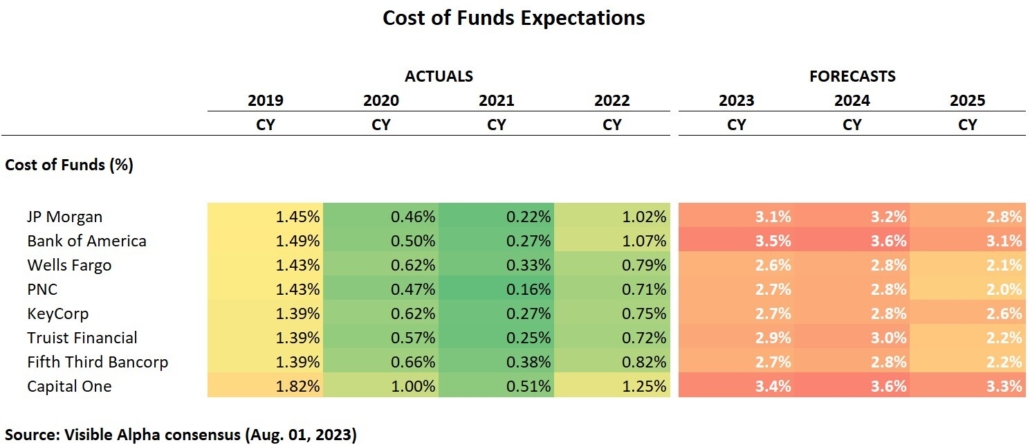
The shift towards interest-bearing deposits is expected to lead to a steady rise in funding costs for the leading banks. Based on Visible Alpha consensus, analysts project increases throughout 2023, as borrowing costs and deposits surge while loan volumes diminish. The cost of funds is projected to ease starting in 2025.

Figure 5: Cost of Funds Projections for Major Banks

Cost of Funds Projections for Major Banks

In our weekly round-up of the top charts and market-moving analyst insights: LVMH’s (EPA: MC) revenue growth in Asia is expected to rebound; Philip Morris International (NYSE: PM) is poised to see significant growth in non-combustible products; Chubb’s (NYSE: CB) North America agricultural segment is facing a slowdown in growth.

Analysts Expect LVMH’s Revenue Growth in Asia to Rebound in 2023

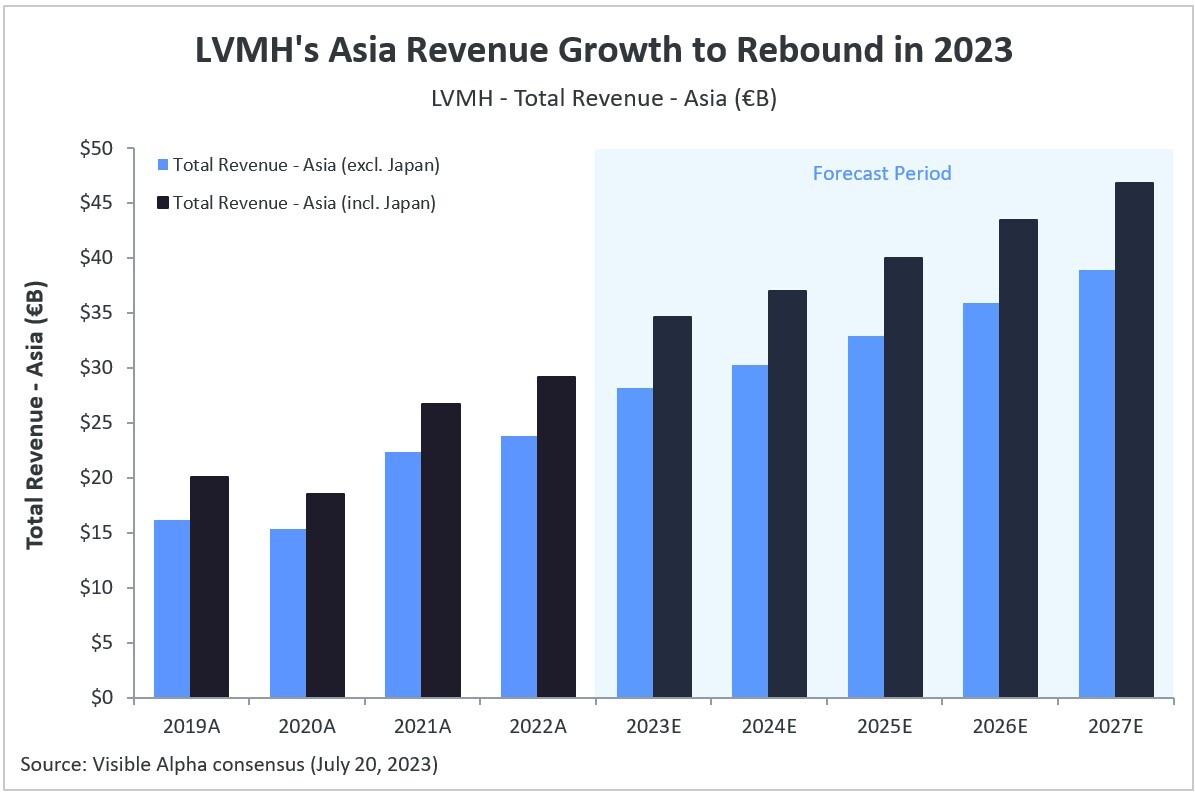
Analysts expect LVMH’s (EPA: MC) revenue growth in Asia to rebound in 2023, buoyed by the late-2022 lifting of anti-Covid measures in China. Based on Visible Alpha consensus, LVMH’s revenue in Asia (excluding Japan) is expected to be up nearly 19% year over year in 2023, reaching €28 billion. This comes after only around 6% revenue growth in the previous year.

2023 revenue in Asia, with Japan included, is also expected to be up nearly 19% year over year, followed by Europe at almost 10%. LVMH’s strong recovery in China is also expected to benefit revenue growth for the luxury goods conglomerate’s fashion and leather goods division, which is projected to grow 13% year over year in 2023, and selective retailing division, projected to grow 16%.

Analysts Expect LVMH's Revenue Growth in Asia to Rebound in 2023

Philip Morris’s Non-Combustible Products Poised for Robust Growth

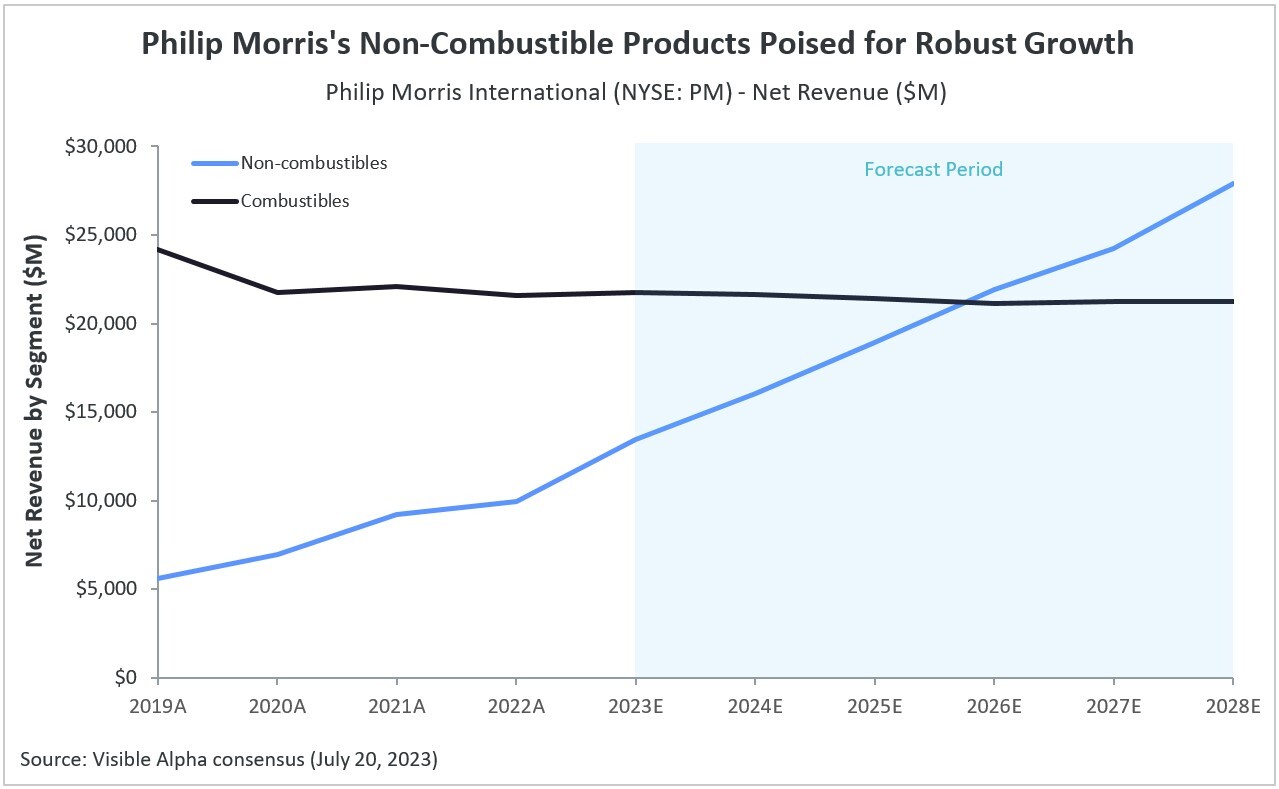
Philip Morris International (NYSE: PM) is poised to see significant growth in its non-combustible tobacco products, according to Visible Alpha consensus. While the net revenue from the company’s combustible tobacco products (cigarettes), has either remained stagnant or declined in recent years, revenue generated by non-combustible alternatives, such as e-cigarettes, heat-not-burn (HNB) tobacco products, and nicotine pouches, has been increasing rapidly.

Analysts anticipate 36% year-over-year growth in net revenue for non-combustible products this year, in stark contrast to less than 1% growth projected for combustible products. Revenue from non-combustibles is expected to surpass that of combustibles by 2026.

Philip Morris's Non-Combustible Products Poised for Robust Growth

Chubb’s North America Agricultural Segment to Face Slower Growth, Say Analysts

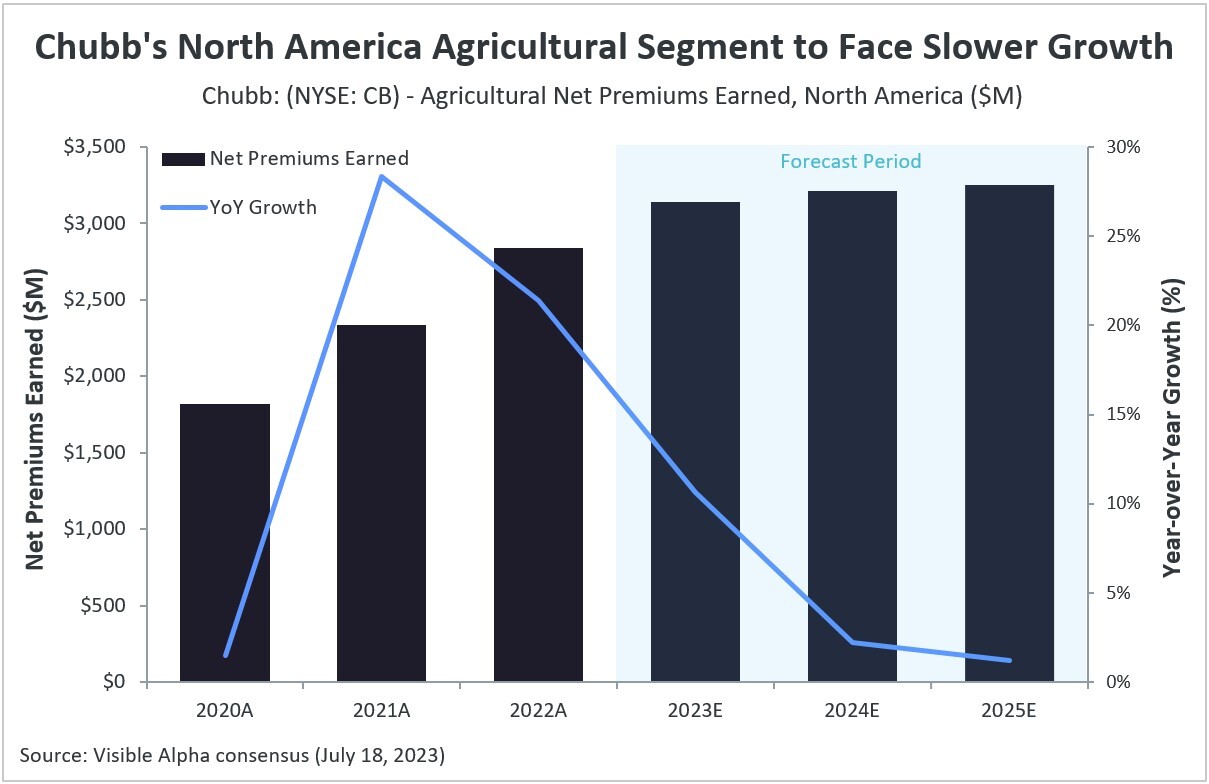
Analysts project a deceleration in the growth rate of net premiums earned by property & casualty insurance giant Chubb (NYSE: CB) within its North American agricultural division during the forecasted period, according to Visible Alpha consensus.

This slowdown in growth is influenced by several factors, including climate volatility and its impact on crop productivity; and given that Chubb’s agricultural segment falls under the federally subsidized crop insurance program, the insurer is limited in its ability to impose higher premiums on agricultural insurance policies.

Chubb's North America Agricultural Segment to Face Slower Growth, Say Analysts

In our weekly round-up of the top charts and market-moving analyst insights: Coinbase’s (COIN) trading volume is expected to remain low despite the crypto rally; Intuit’s (INTU) TurboTax may break its sales record this year; Samsung’s DRAM bit shipments are estimated to fall after production cuts were announced; HOKA is set to outpace UGG as Deckers Outdoor’s (DECK) top-selling brand; and analysts predict Topgolf will drive MODG sales growth through 2025.
Read more

When the pandemic first hit, property and casualty (P&C) insurance companies were called to rise to the occasion. Thankfully, crisis management is the insurance industry’s bread and butter – these are the moments they prepare for and help others to navigate.
Read more

The U.S. Bureau of Labor Statistics published new inflation numbers recently; consumer prices eased to 8.3% in August after climbing 9.1% in June 2022 from the prior year, the highest inflation rate in the U.S. since 1981. To curb inflationary pressures, the Federal Reserve hiked interest rates by 75 basis points in September for the third time this year, to a 3%-3.25% range. In an environment of high inflation, subsequent rising interest rates, and recessionary fears, we look at the top 10 U.S. banks by net loans – JP Morgan & Chase (JPM_US), Bank of America (BAC), Wells Fargo (WFC_US), Citi Group (C_US), US Bancorp (USB_US), Truist Financial Corporation (TFC), PNC Financial Services (PNC), First Republic Bank (FRC_US), Citizens Financial Group (CFG), and M&T Bank (MTB_US) – as they come out of 2Q FY22 earnings.

Read more

This is the third part and final part of this series. 

In the U.S., publicly traded companies routinely reward shareholders with cash payouts. There are two types of common payout vehicles:

  • Cash dividend per share
  • Share repurchases

Read more

This is the second part of a three-part series. 

In the U.S., publicly traded companies routinely reward shareholders with cash payouts. There are two types of common payout vehicles:

  • Cash dividend per share
  • Share repurchases

Read more

This is the first part of a three-part series. 

In the U.S., publicly traded companies routinely reward shareholders with cash payouts. There are two types of common payout vehicles:

  • Cash dividend per share
  • Share repurchases

Read more