The Visible Alpha AI Monitor aggregates publicly-traded U.S. technology companies, providing a comprehensive measure of the current state and projected growth of the core AI industry. This encompasses the AI-exposed revenues for companies that are building AI infrastructure and capabilities for both enterprises and consumers.
Investors may use the Visible Alpha AI Monitor to generate new ideas to capture growth emanating from the core AI industry, as well as to evaluate the potential AI exposure of technology stocks in their existing portfolios. We have identified specific line items that capture potential growth of AI-related revenues that are available in the Visible Alpha Insights platform (see the goals, objectives, and methodology of the AI Monitor towards the bottom of this page).
The Visible Alpha AI Monitor: Generative AI adoption
The generative AI (GAI) trend gained momentum in 2023 as Cloud Service Providers invested heavily. In 2024, the GAI theme is continuing to evolve and gain momentum. This year looks poised to be the year of GAI adoption in enterprises. Visible Alpha is observing GAI make a greater push into organizations to drive efficiency and growth, while enhancing the client experience. The verdict is still out on whether or not GAI will yield real value for businesses and support stronger fundamentals and earnings growth. However, the trend toward GAI adoption is undeniable.
In Q1 2024, we added Autodesk, ServiceNow, Vertiv, Super Micro Computer, Crowdstrike, Lam Research and Broadcom to the AI Monitor universe, increasing from 63 to 69 companies. Alteryx was acquired and dropped out of the AI Monitor. Liveperson’s coverage dropped below our four-source threshold and will be removed next quarter.
Figure 1: AI growth and performance overview
Source: Visible Alpha consensus (April 17, 2024). Stock price data courtesy of FactSet. Current stock prices are as of the market close on April 16, 2024. TOP 10 = IBM, Qualcomm, Oracle, Microsoft, Intel, Amazon, Super Micro Computer, Dell, Nvidia, Google. These firms currently have the largest revenue-generating segments geared to AI.
Visible Alpha 2024 Watchlist: 6 Companies to Watch in 2024
- Dell (NYSE: DELL) (new addition)
- Oracle (NYSE: ORCL)
- Microsoft (NASDAQ: MSFT)
- Snowflake (NYSE: SNOW)
- Sprinklr (NYSE: CXM)
- Zeta Global (NYSE: ZETA)
In 2024, we are watching the pace at which companies will be moving more of their data to the cloud and enabling innovation with AI. The AI Monitor aims to help users observe the pace of data migration to the cloud by highlighting companies and line items. In particular, we have been watching several companies since the beginning of the year.
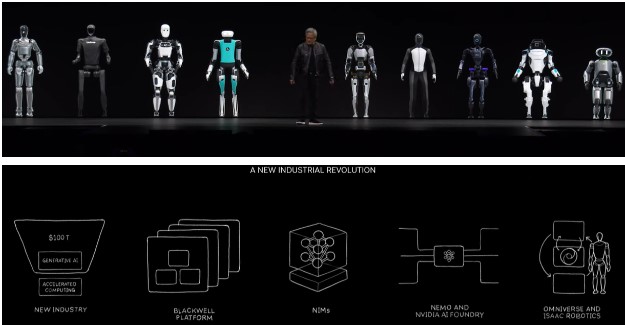
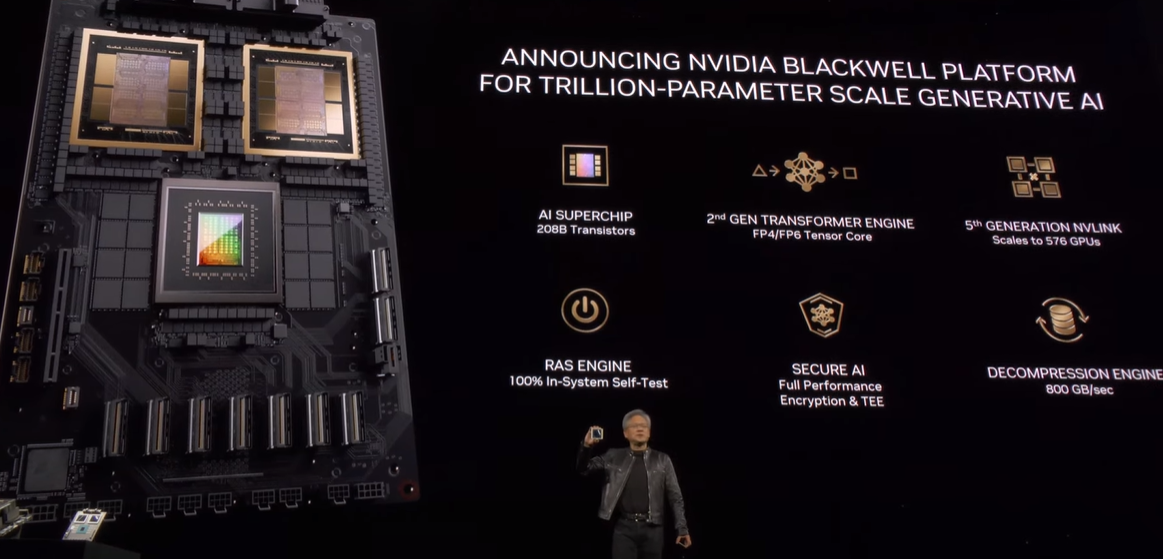
We are closely tracking the performance of Oracle’s Cloud Services and Microsoft Azure’s Infrastructure and Platform as a Service businesses. Together, this partnership may bring more organizations to the cloud and position enterprises for integrating AI into their workflows. As enterprises shift to the cloud and look for end-to-end solutions to support working with generative AI, we have recently added Dell to our watchlist. Nvidia CEO Jensen Huang called out Dell CEO Michael Dell in the audience at Nvidia’s GTC (GPU Technology Conference) recently.
As more data goes into the cloud, we are also monitoring Snowflake’s growth. This stock is down over 30% since last quarter when it delivered lackluster guidance and changed CEOs. Snowflake enables organizations to de-silo their data and compare/share with other data sources across the enterprise, serving as a good starting point for leveraging AI across their enterprise. At a recent tech conference, Snowflake management said “the most common type of data going into Snowflake is CRM data.”
And as more customer relationship data moves to the cloud and into Snowflake for sharing between marketing, sales, and other teams, Sprinklr and Zeta Global may benefit from the need to unify and understand customer interactions.
As companies large and small establish their data, cloud, and AI strategies, what new innovations and companies will drive AI-exposed revenues in 2024 and beyond?
Updates to the AI Monitor
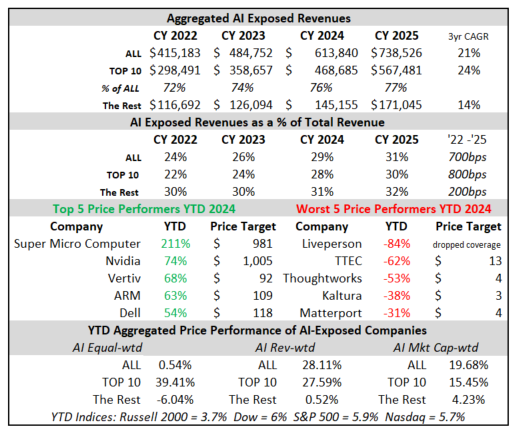
In 2023, eight out of the 10 largest AI-exposed revenue generators drove strong outperformance, while more than 50% of the smaller-cap AI stocks underperformed. Post-Q1, AI-exposed revenues are expected to grow by over $320 billion, from $415 billion at the end of 2022 to $739 billion at the end of 2025, driven overwhelmingly by the Top 10 largest in the AI Monitor.
Figure 2: AI-exposed revenue aggregations
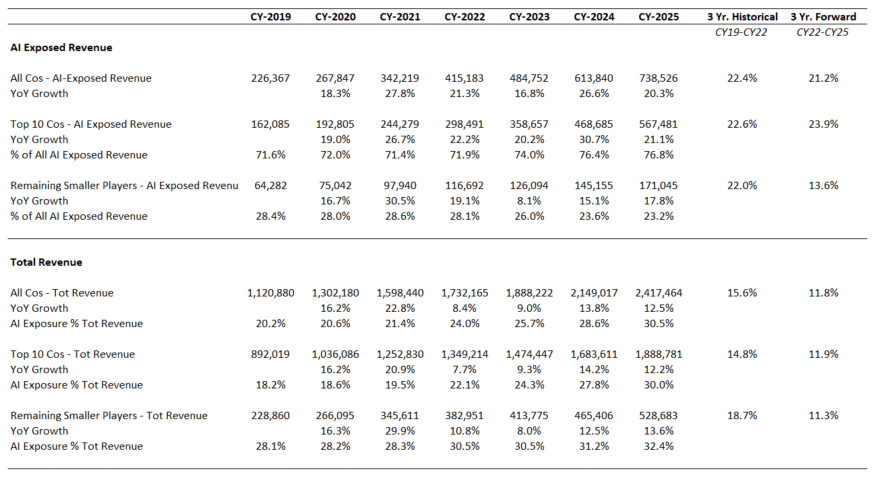
Source: Visible Alpha consensus (April 17, 2024). Stock price data courtesy of FactSet. Current stock prices are as of the market close on April 16, 2024. TOP 10 = IBM, Qualcomm, Oracle, Microsoft, Intel, Amazon, Super Micro Computer, Dell, Nvidia, Google. These firms currently have the largest revenue-generating segments geared to AI.
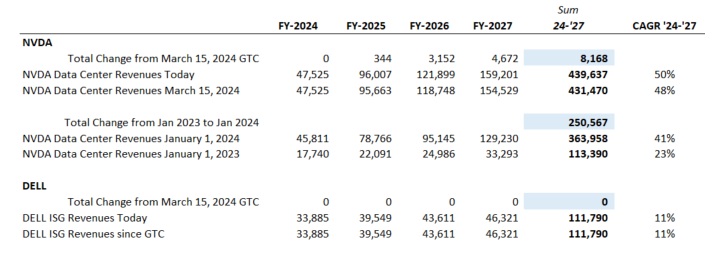
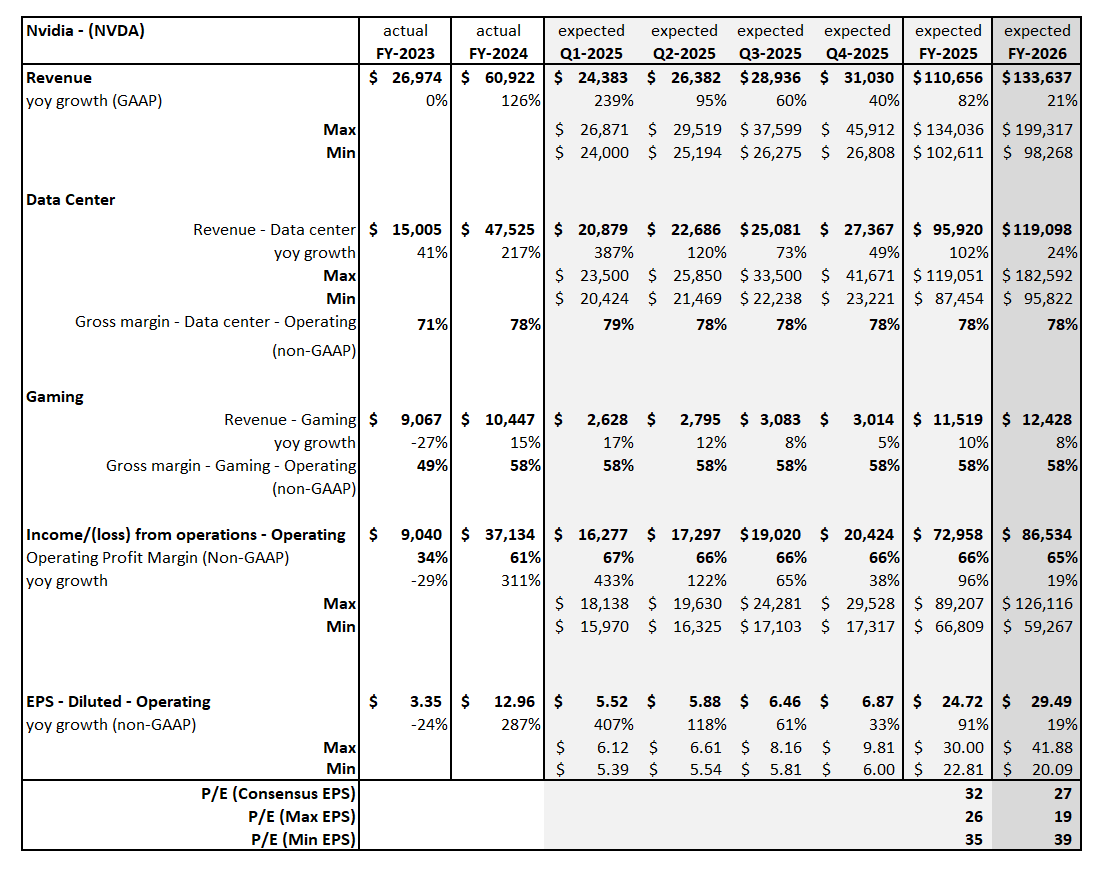
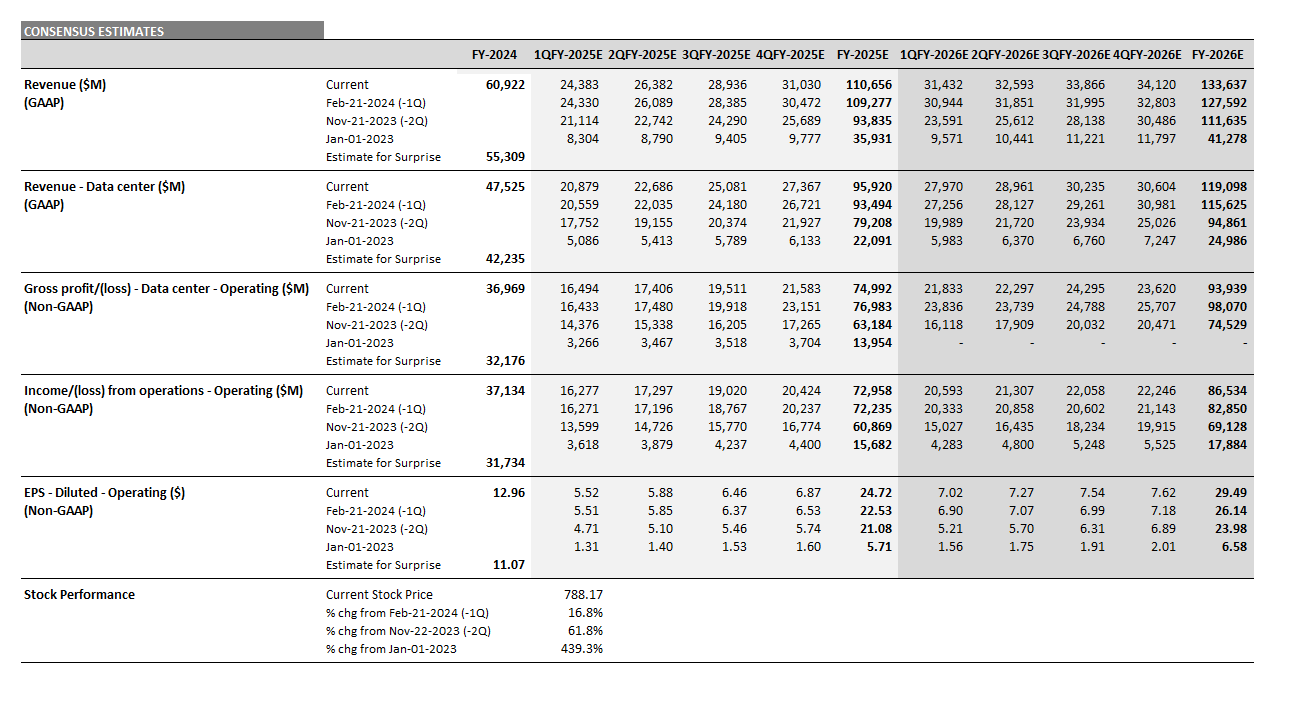
The revenue growth of the Top 10 is driven by the $230 billion of upward revisions analysts have made to Nvidia’s AI-exposed data center and Super Micro Computer’s AI-exposed server and storage systems revenues, which contributed significantly to both the AI-exposed revenue concentration and stock performance of the AI Monitor. Dell estimates for the AI-exposed Infrastructure Solutions Group revenues have come up nearly $9 billion for 2024 and 2025. How may these dynamics change through the rest of 2024?
New Additions to the AI Monitor
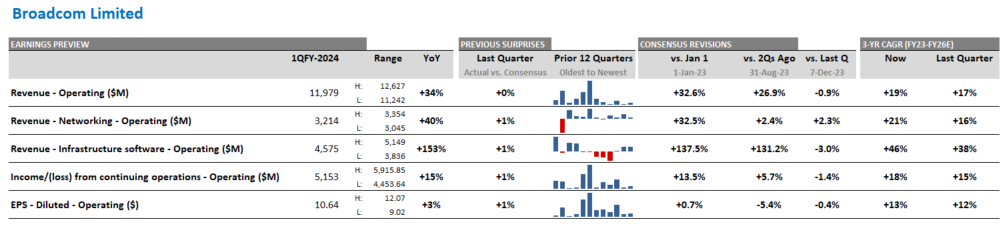
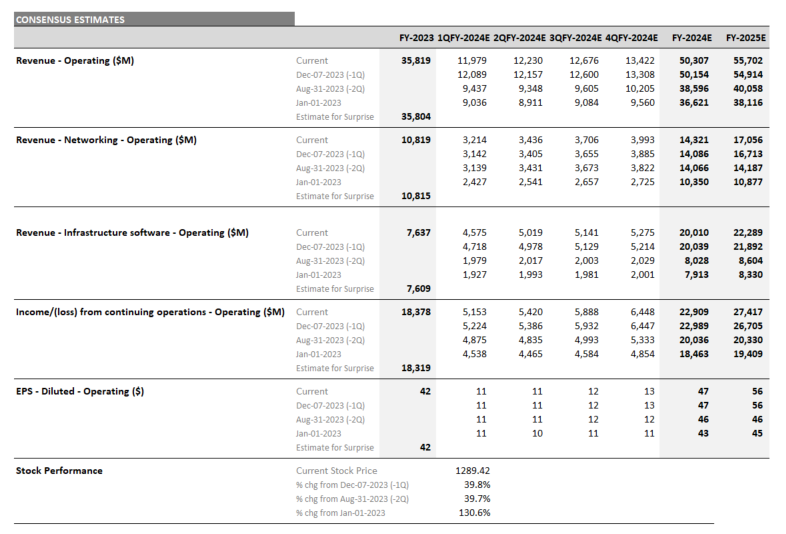
- Broadcom (NASDAQ: AVGO)
- Super Micro Computer (NASDAQ: SMCI)
- Vertiv (NYSE: VRT)
- ServiceNow (NYSE: NOW)
- Autodesk (NASDAQ: ADSK)
- Crowdstrike (NASDAQ: CRWD)
- Lam Research (NASDAQ: LRCX)
Figure 3: AI-exposed revenue revisions summary
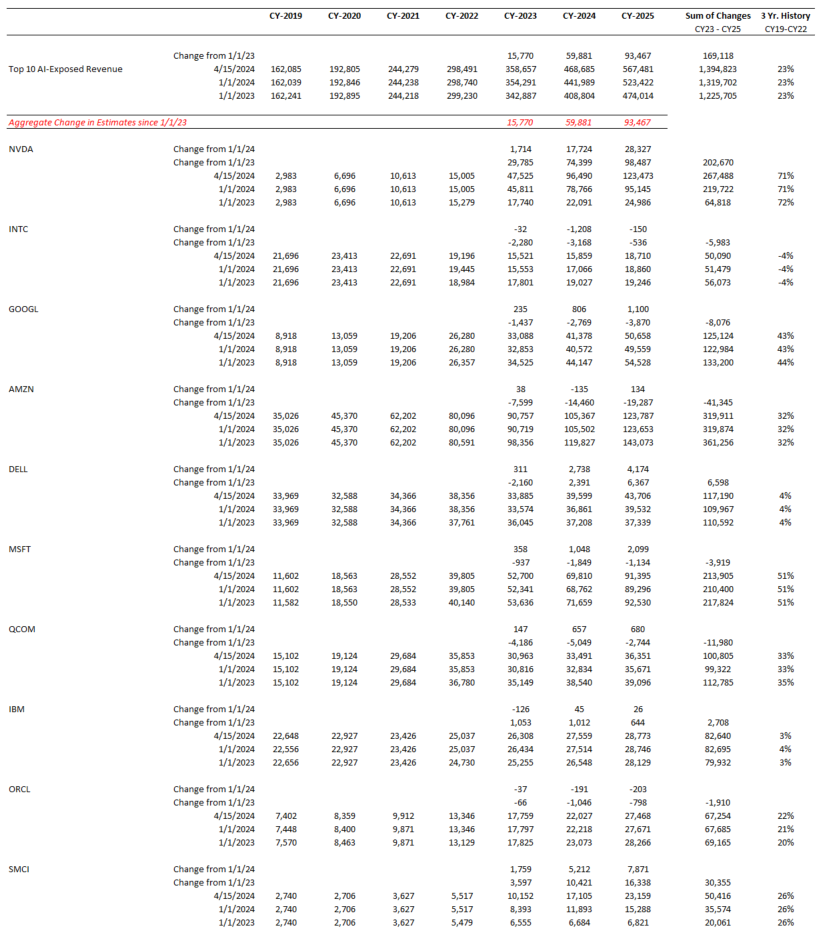
Source: Visible Alpha consensus (April 17, 2024). TOP 10 = IBM, Qualcomm, Oracle, Microsoft, Intel, Amazon, Super Micro Computer, Dell, Nvidia, Google. These firms currently have the largest revenue-generating segments geared to AI.
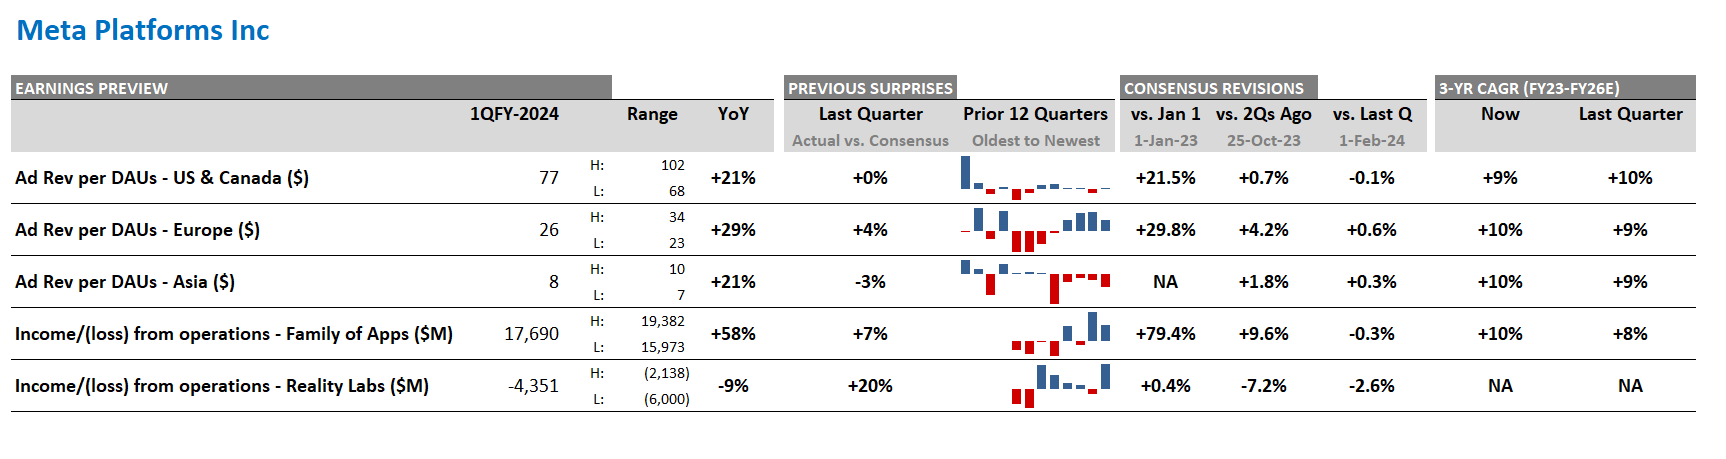
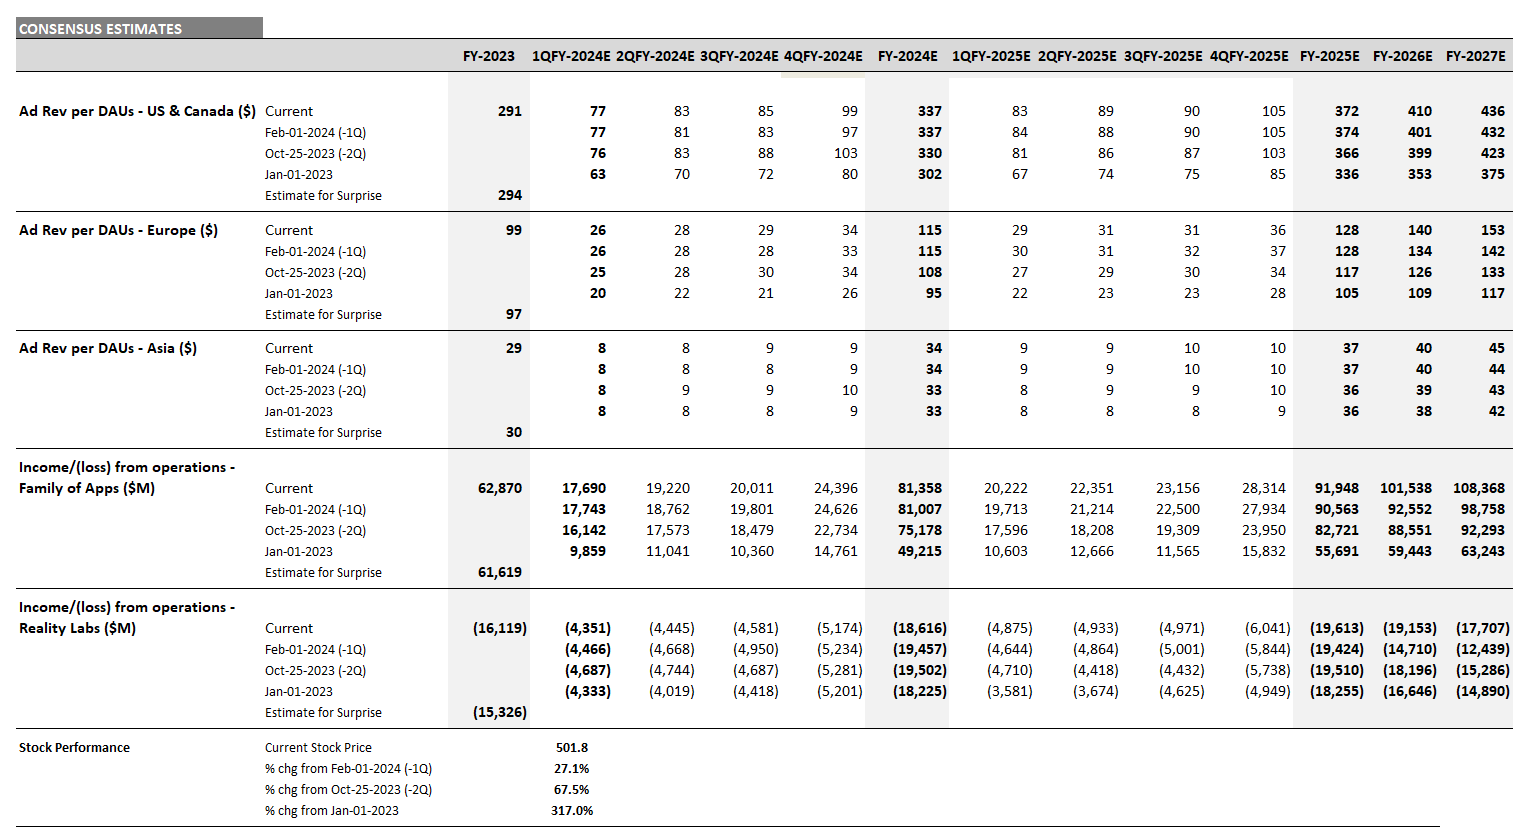
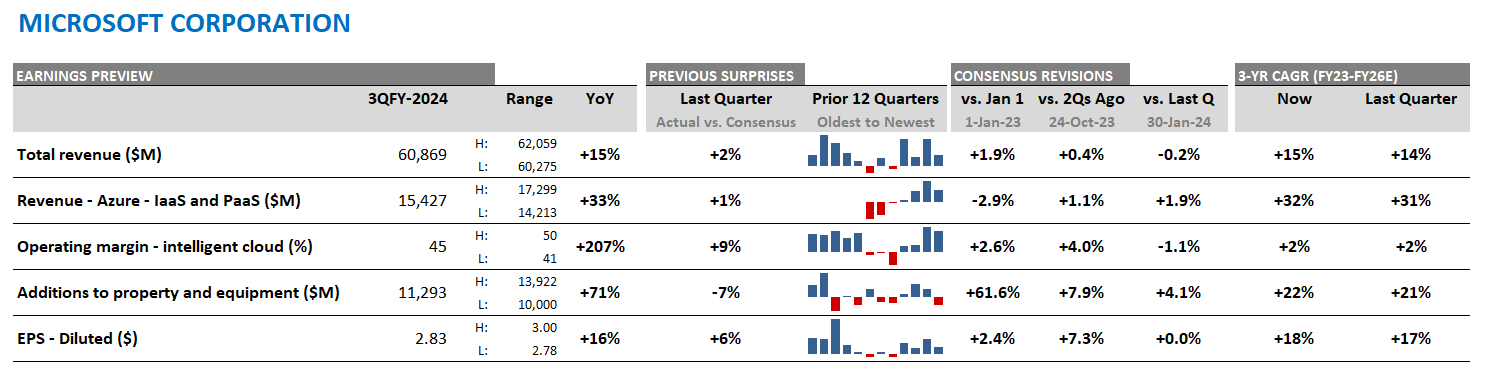
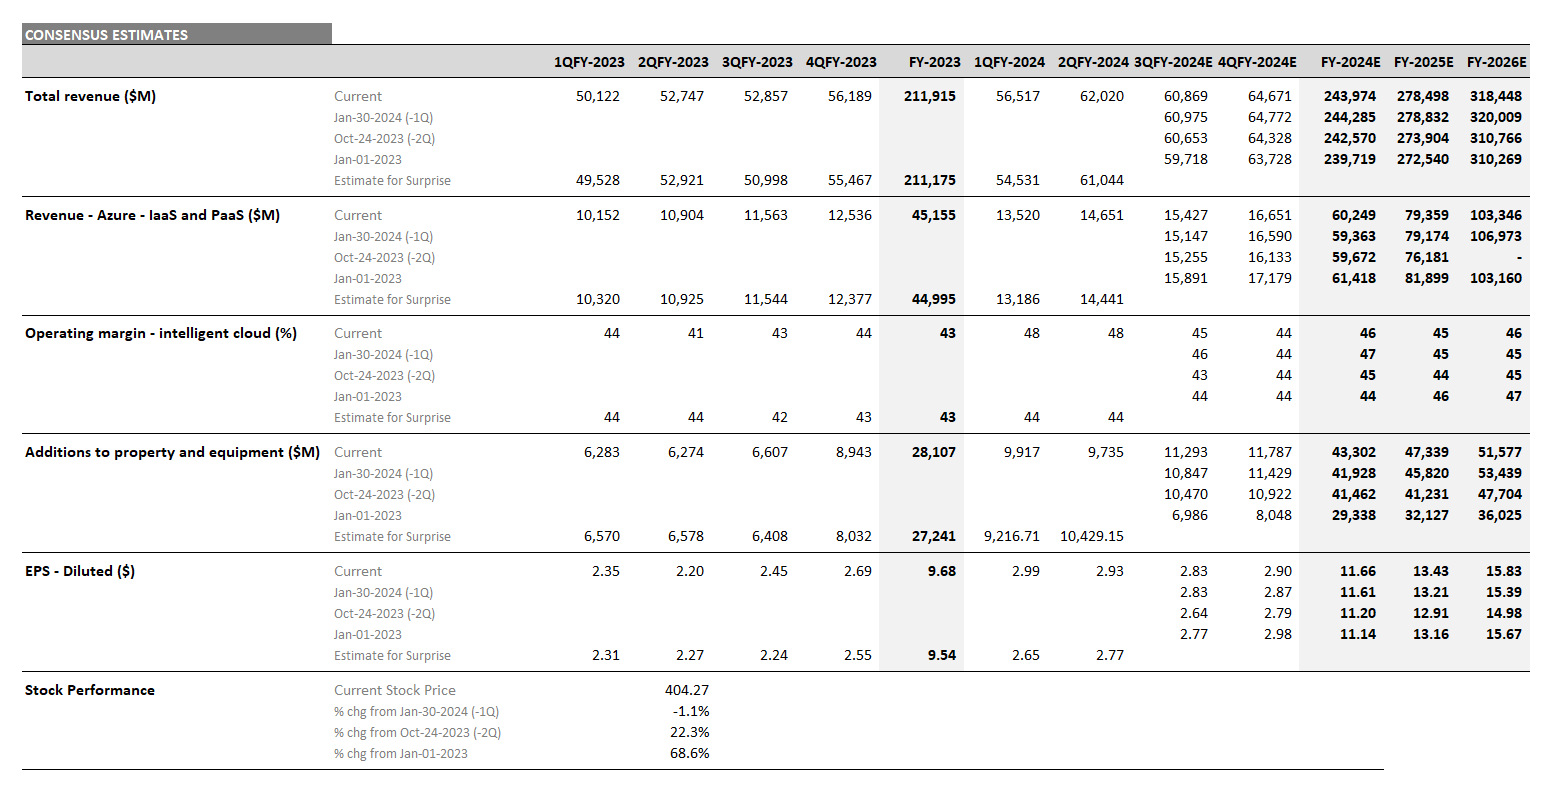
Oracle and Microsoft: How will this partnership help to drive cloud migration and AI in 2024 and 2025?
Access to data will be a critical dimension to anything a customer wants to do with AI. Back in the fall of 2023, Oracle CTO Larry Ellison and Microsoft CEO Satya Nadella explained that their partnership will enable customers to co-locate the Oracle hardware and software within the Azure Data Center, which will be key for fine-tuning, pre-training, or meta-prompting a model for AI.
With a large portion of data still located on-premise, they believe this collaboration should encourage companies to move to the cloud by lowering latency and increasing security. Once the data is in the cloud, customers can begin to innovate with it. From the Azure portal, users can provision an Oracle database, then marry that to Open AI and, ultimately, to the library of Microsoft technology.
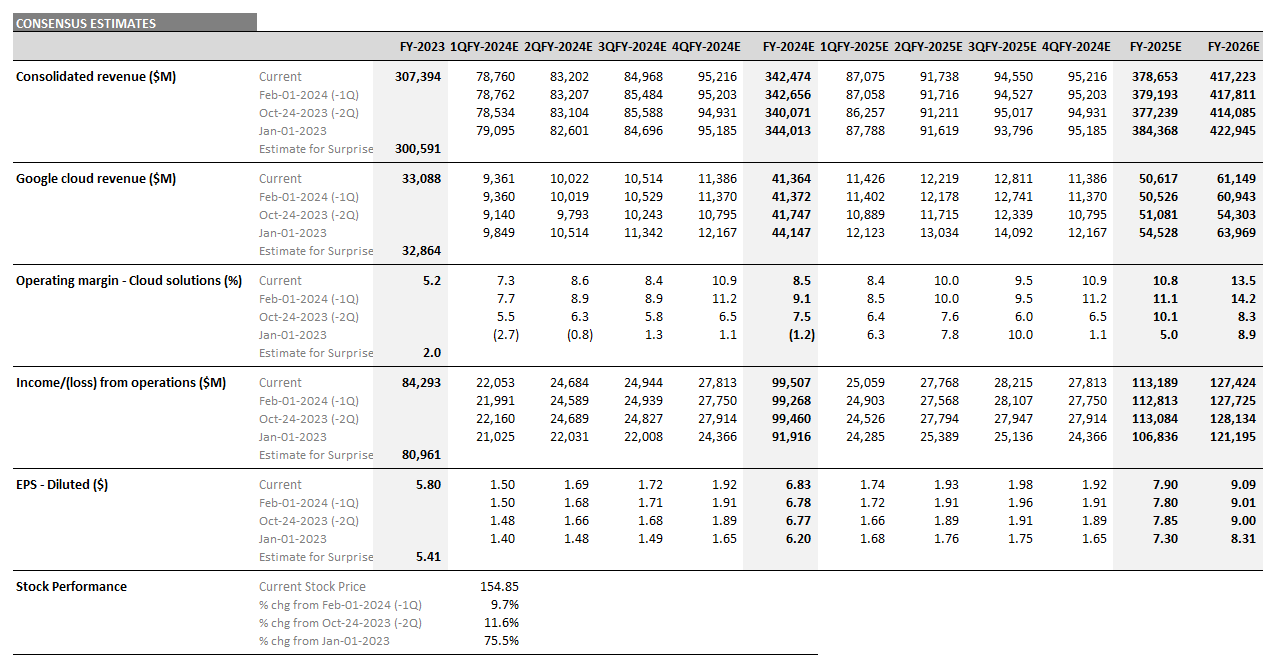
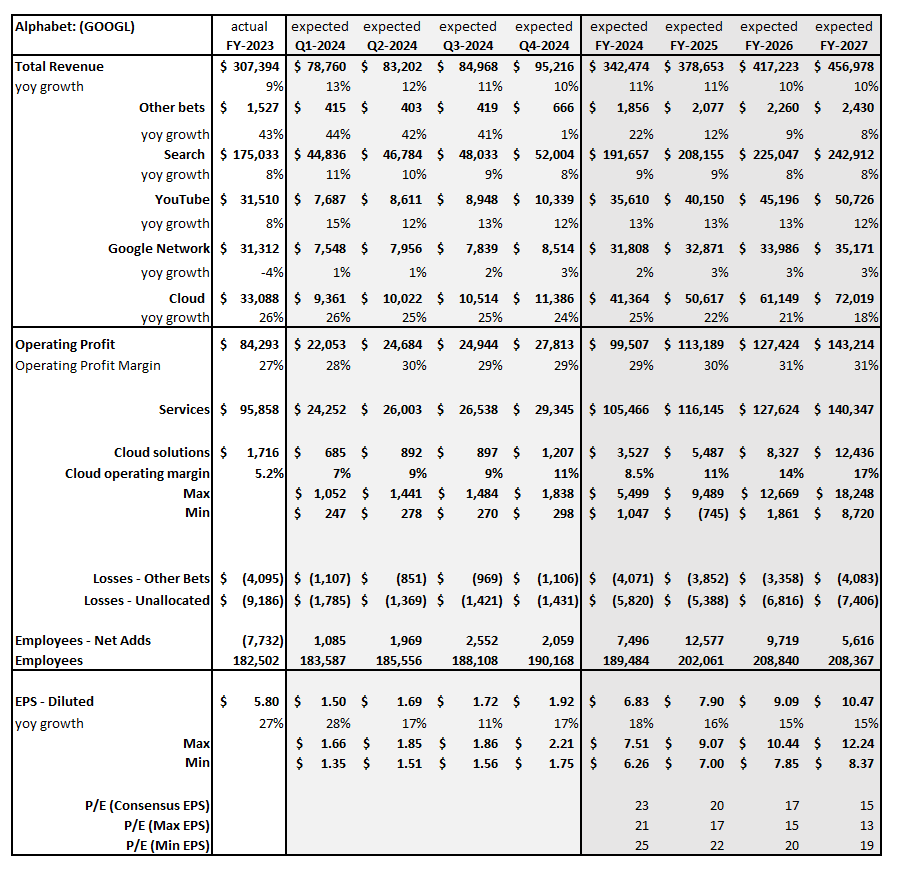
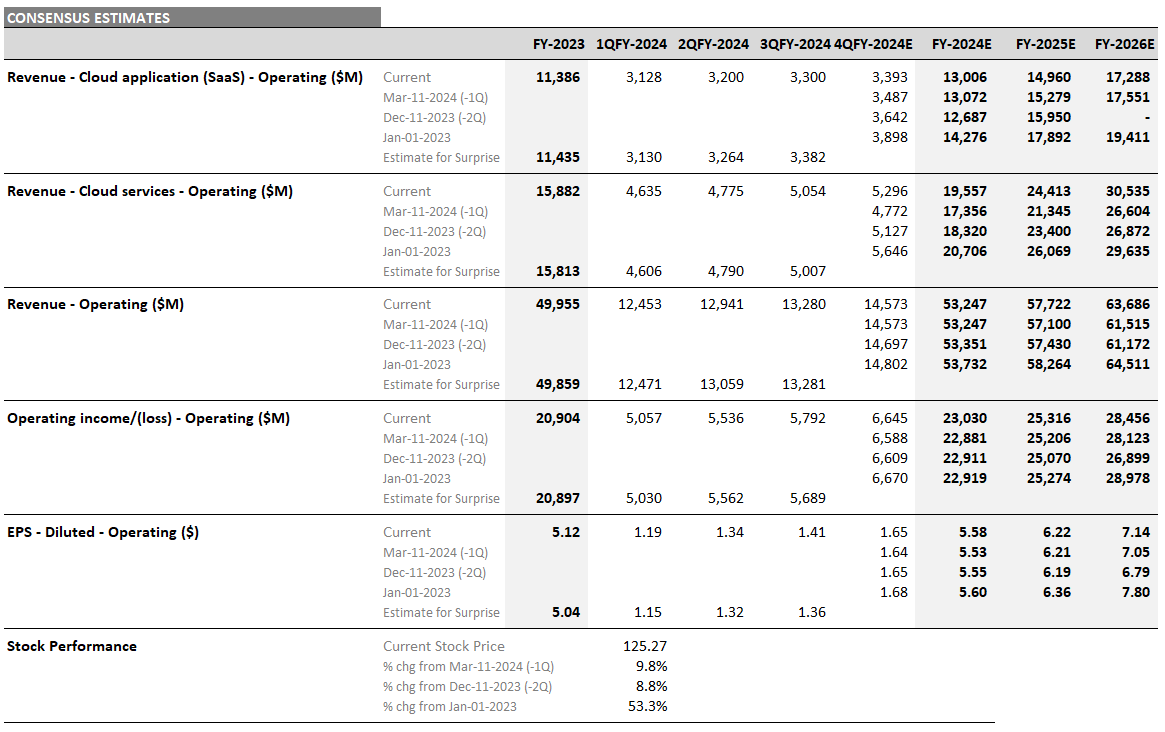
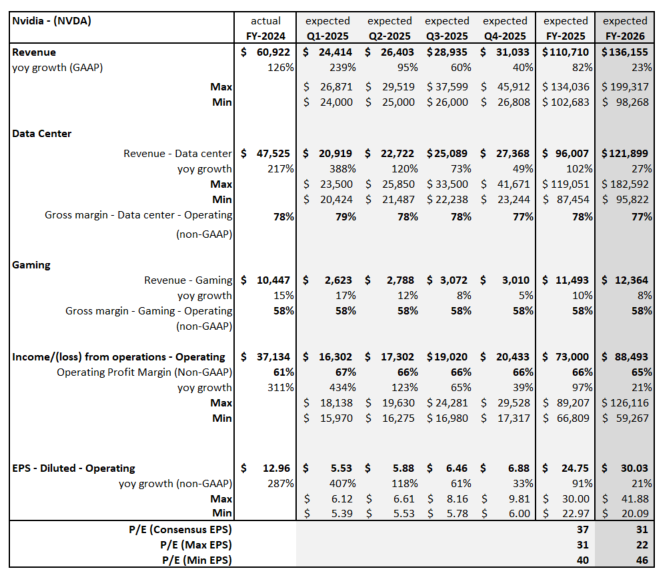
Both Microsoft and Oracle estimates have ticked up since January. Currently, analysts are expecting Microsoft’s June 2024 Azure revenue to be $74 billion and to double to $149 billion by June 2027, driven by growth of Infrastructure and Platform as a Service businesses within Azure. Similarly, Oracle’s May 2024 revenue from Cloud Services is projected to double from $20 billion to nearly $39 billion by May 2027. Given the partnership, could the pace of this growth show up faster for both Microsoft’s Azure and Oracle’s Cloud Services business lines?
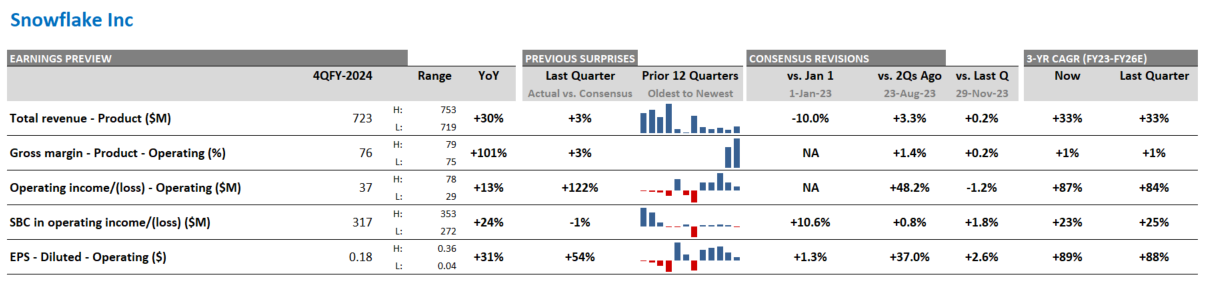
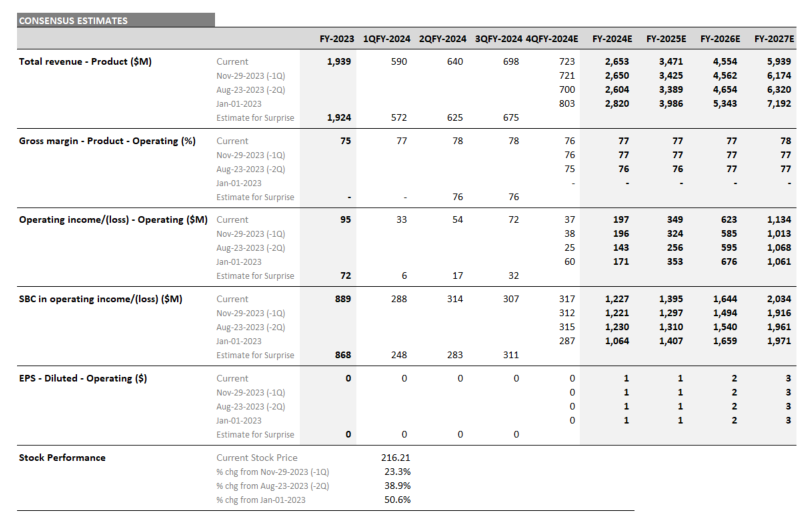
Snowflake
Speaking at a tech conference in December, Snowflake CFO Mike Scarpelli echoed points around the cloud, data, and AI that were similar to Oracle and Microsoft. He explained that to reap the benefits of generative AI, companies are going to use it in the cloud, instead of on-prem. Therefore, organizations will need to ensure their data is clean and in the cloud for their large language models to be useful.
As companies look to integrate AI into their organizations, the market for the Snowflake product looks poised to reaccelerate over the next year. However, the stock has declined over 30% since the disappointing guidance in March and the surprising CEO change. CEO Sridhar Ramaswamy brings the engineering lens to the role. The Q1 earnings call will likely set the stage for Ramaswamy and the stock. Could Q1 be a positive catalyst for the stock?
According to Visible Alpha consensus, revenues from product are estimated to be $3.3 billion in CY 2024 and grow now to $4.1 billion in CY 2025, down from last year’s $5.3 levels. The gross margin is projected to decline from 77.8% to 76.4% in FY 2025, driven by slower expected growth. There is currently debate about whether or not the guidance is conservative. The Q1 performance will likely set the tone for new CEO Sridhar Ramaswamy’s first year in the job.
According to Scarpelli, the most common type of data going into Snowflake is customer relationship management data. Therefore, we wanted to highlight two smaller-cap companies that are bringing AI innovations to their client’s marketing teams: Sprinklr and Zeta Global.
Sprinklr
Through its specialized AI models, Sprinklr aims to provide a unified customer-experience platform for tracking all the places a customer may interact with a company’s brand, especially on social media outlets. With a market cap of $3.1 billion, Sprinklr may benefit from any rotation to smaller-cap stocks that are benefiting from the AI theme and its growth trends.
Recently, the company has taken steps to improve operational visibility and address the challenges in its core business. According to Visible Alpha consensus, AI-exposed subscription revenue projections for CY 2024 have increased since last quarter, from $740 to $805 million, and for CY 2025, from $836 to $897 million. Given the renewed confidence in CY 2025 expectations, could Sprinklr rise above the challenges and beat consensus?
Zeta Global
With a market cap of $2.5 billion, Zeta Global is a smaller-cap company that looks well-positioned to benefit from its exposure to AI. Through the Zeta Marketing Platform (ZMP), COO Steve Gerber’s vision is to leverage their proprietary AI and data tools to unify identity, intelligence, and omnichannel activation into a single platform. Having clean data in the cloud for data sharing within organizations may become an increasingly important driver as customers look to centralize data for AI applications. Zeta Global’s partnership with data-sharing platform Snowflake may play a critical role in supporting the company’s growth.
According to Visible Alpha consensus, Zeta Global’s AI-exposed revenues are estimated to hit close to $1 billion by year-end 2025, from $709 million in CY 2023, as organizations adopt more advanced marketing technology.
Performance Summary
Currently, the Visible Alpha AI Monitor universe of 69 publicly traded U.S. companies is 76% weighted to the 10 largest companies, with the remaining 24% dispersed among 59 companies.
On a market-cap weighted and AI-exposed revenue-weighted basis, the Visible Alpha AI Monitor continues to be driven by substantial stock price outperformance (vs. the S&P 500 index) of the largest companies this year. In addition, the smaller companies are continuing to underperform (vs. the S&P 500 index), especially on an equal-weighted basis.
On an equal-weighted basis, the AI Monitor would have generated significantly lower return when compared to the market-cap and AI-exposed revenue-weighted aggregations this year, driven by the drag of a lower return generated by the smallest names.
Top 10
Based on an analysis of the 10 largest players, 2025 revenue forecasts for AI-exposed revenue segments increased $44 billion in total since January 2024. However, nearly $28 billion of the 2025 increase is from Nvidia, $8 billion from Super Micro Computer, and a further $4 billion increase from Dell. The declines in revenue estimates that the rest of the Top 10 has seen since January 2023 has largely stopped since the beginning of 2024. The downward revisions were driven by lower expectations for AWS, Google Cloud, and Qualcomm QCT. However, the estimates for these companies have moderated and in some cases, started to tick up, suggesting that the cuts to 2025 revenue expectations may have been too deep.
Smaller Contributors
The remaining list of 59 companies may serve as a good place for investors to discover new ideas by surfacing expanding new players. While smaller companies in aggregate have not performed as well as the Top 10, there have been some clear outperformers relative to the composite.
Among the smaller firms, revenue growth expectations are very mixed. Strong double-digit revenue growth is expected at some firms, while others are seeing estimates decline. These dynamics may help investors identify emerging trends in the space.
In 2023, we have already seen that to be true with Zeta Global, Pegasystems, and Informatica delivering strong outperformance (vs. the Russell 2000), which may help position these firms longer term as the up-and-comers in the space. Vertiv and Palantir are mid-caps with strong AI-exposed revenues and stock prices showing positive outperformance.
In contrast to these small-cap and mid-cap outperformers, more than half of the smaller companies in the AI Monitor substantially underperformed the Russell 2000 return of 3.7% YTD. This weakness may imply that these companies are under pressure and may be seeing compression in their valuations. This weakness may make some of these companies acquisition candidates by larger firms. TTEC, Thoughtworks, and Liveperson fell by more than 50% YTD in 2024, off significant declines in 2023.
Figure 4: AI Monitor aggregated stock return breakdowns
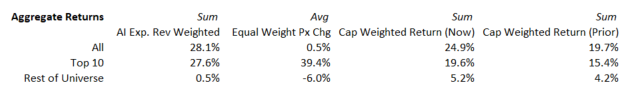
Source: Visible Alpha consensus (April 17, 2024). Stock price data courtesy of FactSet. Current stock prices are as of the market close on April 16, 2024. TOP 10 = IBM, Qualcomm, Oracle, Microsoft, Intel, Amazon, Super Micro Computer, Dell, Nvidia, Google. These firms currently have the largest revenue-generating segments geared to AI.
Figure 5: AI Monitor detailed breakdown
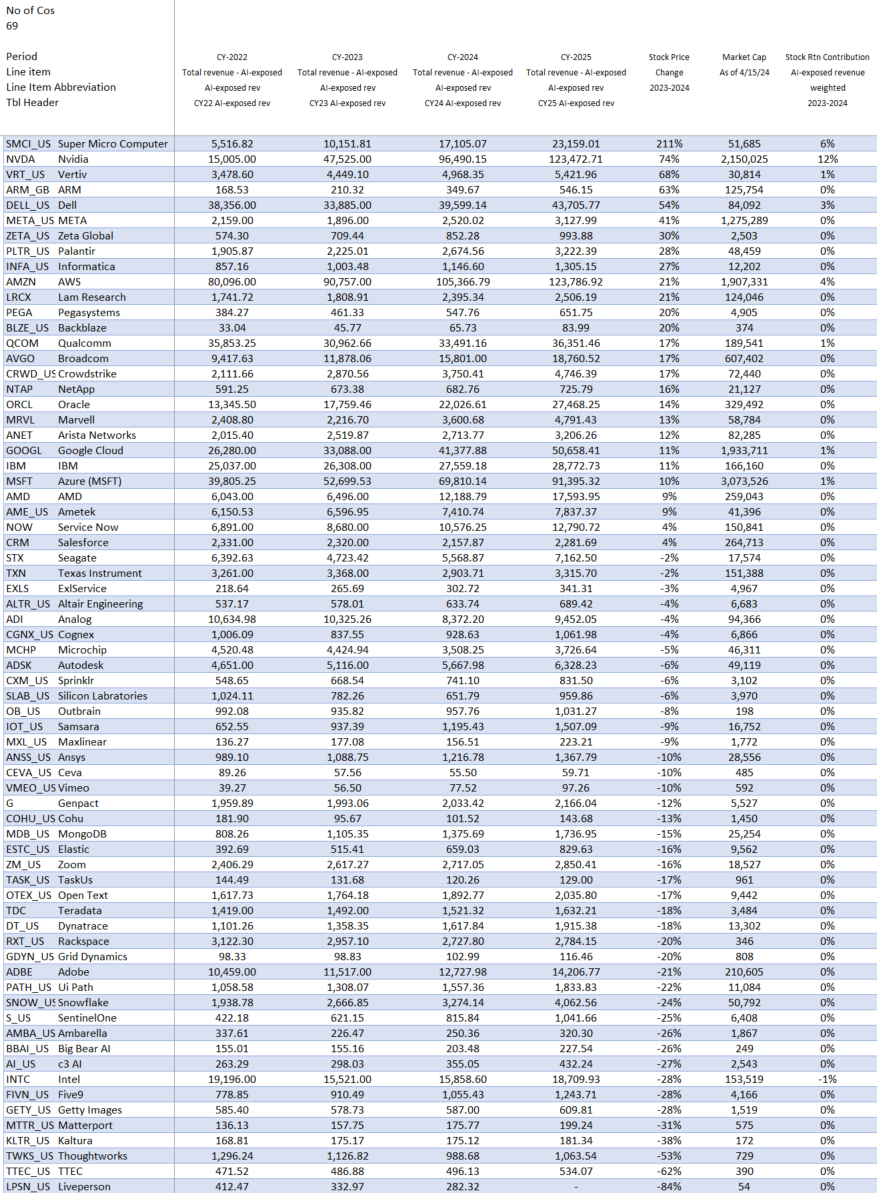
Source: Visible Alpha consensus (April 17, 2024). Stock price data courtesy of FactSet. Current stock prices are as of the market close on April 16, 2024. TOP 10 = IBM, Qualcomm, Oracle, Microsoft, Intel, Amazon, Super Micro Computer, Dell, Nvidia, Google. These firms currently have the largest revenue-generating segments geared to AI. Based on higher analyst counts, we are using the non-GAAP revenue number for Oracle and Ansys.
Regulatory Backdrop
The regulatory backdrop can have an impact on the potential adoption and growth of AI. Increased regulatory scrutiny is one potential obstacle to scaling GAI applications in organizations. In addition, there may be more regulatory hurdles around acquisitions that could bring about consolidation in the space. In the fall of 2023, President Biden issued an Executive Order to “ensure that America leads the way in seizing the promise and managing the risks of artificial intelligence (AI).” The Order contained initiatives to strengthen AI safety and security, privacy protections, innovation and competition, along with supporting consumers, workers, and equity. In January 2024, the agencies completed more than two dozen activities around AI talent, risks, and implications for the U.S. In addition, the White House has created a blueprint for an AI Bill of Rights (ai.gov).
As the government continues to focus on AI and its implications for the U.S., Stanford University released an update in April 2024 to its AI Index. The report captures the number of new AI-related regulations by agency in 2023 and shows the surge in proposed bills. The trajectory of the proposed regulations suggests we may see more regulations in 2024 and 2025. In addition, a wider range of agencies may be looking to add specific regulations going forward.
Figure 6: Proposed AI-related regulations by agency in the U.S.
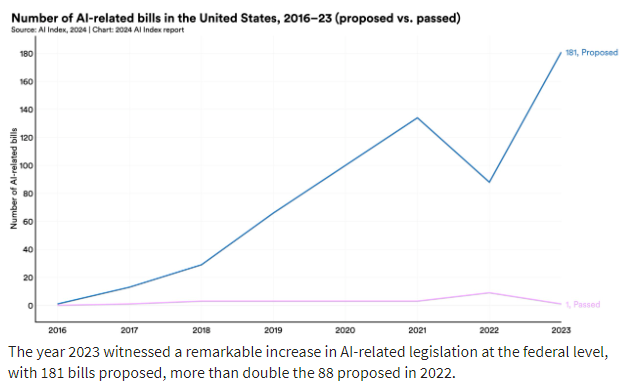
Source: Stanford University AI Index 2024 (https://aiindex.stanford.edu/report/)
Figure 7: U.S. AI-related regulations by agency
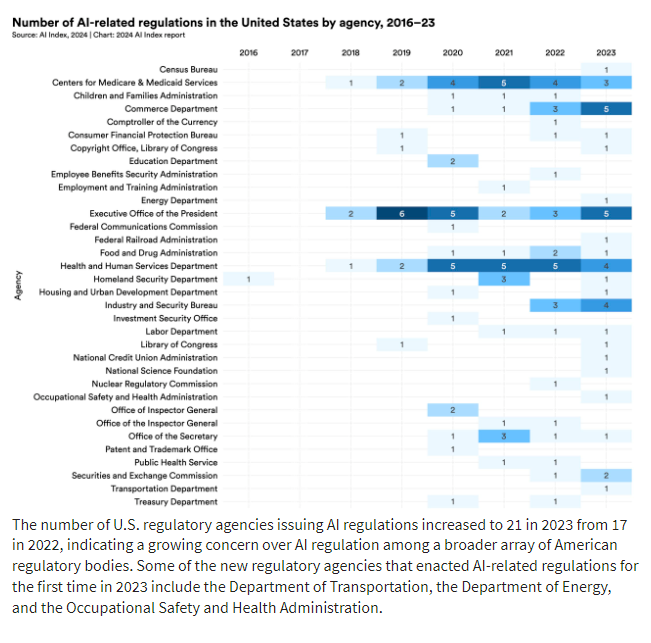
Source: Stanford University AI Index 2024 (https://aiindex.stanford.edu/report/)
Final Thoughts
In 2024, Nvidia continues to lead in the space. However, Super Micro Computer is the best performer so far this year. Vertiv, ARM, and Dell have emerged as this year’s big performers year to date as the industry looks for scalable infrastructure solutions. These firms have surpassed last year’s winners, Palantir, Samsara, and C3 AI, which saw their exposure to AI translate into meaningful stock outperformance in 2023 relative to the S&P 500 index. The focus seems to be shifting from cloud service providers (CSPs) to scalable enterprise applications for GAI. For many firms, however, it is not clear how they will participate in bringing GAI to enterprises and grow the impact of AI-exposure in their business models.
In 2024, we are watching the pace at which companies will be moving more of their data to the cloud and enabling innovation with AI in enterprises. We are interested to see how the partnership between Oracle and Microsoft could help to drive more organizations to the cloud and set up their enterprises for integrating AI into their workflows. Through its data sharing and analytics capabilities, Snowflake is likely to play a role in the roll out of the AI ecosystem. Snowflake’s clients seem to be increasingly aiming to de-silo their data and organizations to understand how best to serve their customer base. As more customer relationship data moves to the cloud and into Snowflake for sharing and AI, it will be interesting to see if Zeta Global will continue to benefit from these dynamics happening in different parts of the tech stack.
Will Q1’s winners continue to drive the Visible Alpha AI Monitor for the rest of 2024?
AI Monitor Goals and Objectives
The objective of the Visible Alpha AI Monitor is to show the investment community which companies are likely to drive AI going forward. As the world embraces AI and its applications to enterprise workflows and our daily lives, big questions exist about how AI’s impact on company business models will unfold over the next 3-5 years. AI can potentially free people from tedious gruntwork to enable more focus on critical workflows that require human creativity and analysis.
A primary goal of the Visible Alpha AI Monitor is to show which U.S. companies and specific line items we are keeping an eye on as the embryonic AI theme emerges across company fundamentals and begins to scale broadly across the economy. We are monitoring how AI may be reflected in the numbers and which companies may be benefitting more or less. This universe attempts to be comprehensive and to show investors the dynamics of both the large and smaller U.S. players. Additionally, it aims to help investors identify new names that may be smaller and less covered, but potentially growing and emerging more quickly.
AI Monitor Methodology
Using Visible Alpha’s comprehensive database of detailed estimates pulled directly from sell-side analysts’ spreadsheet models, we have assembled an aggregation with a universe of 69 publicly-traded companies that are contributing to the infrastructure and broad scaling of AI capabilities. This monitor aims to provide a current and future snapshot as to where AI-related revenues are and are not growing across each of these 69 companies, and particularly the 10 largest.
We have aggregated the revenues of specific business segments at firms that are driving the wider AI trend. For larger firms, we have attempted to pinpoint where in their revenue model AI is driving growth. For some smaller firms, we are simply incorporating 100% of revenues. The AI-exposed revenue lines we identify are intended to be used as a proxy for monitoring the growth of each company’s AI business. Given both lack of discrete company disclosures and how intertwined AI and conventional technologies and services can be, these lines should not be taken as exact quantifications of AI revenues, but are, we believe, the best systematic approximation available.
The AI Monitor provides three measures of stock performance for its universe. These metrics are meant to show the returns of various weighting schemes. The returns are calculated on both an equal-weighted and market-cap weighted basis. The universe performance of the AI Monitor is also weighted based on AI-exposed revenues and calculated in aggregate. From 2024, the return calculations were standardized and market-cap-weighted now reflects year-over-year changes.
For Visible Alpha subscribers, details of these companies can all be found within the Visible Alpha Insights platform. Each company included in the monitor has coverage by at least four sell-side analysts. In addition, given the quickly evolving state of the AI space, these line items are subject to change and may shift significantly over time. We plan to refresh the data on an ongoing basis and provide regular updates. |