Nvidia (NVDA) Earnings Preview: Fiscal Q4 2024
By: Melissa Otto, CFA
Nvidia Corp. (NASDAQ: NVDA) will report fiscal Q4 2024 results on Wednesday, February 21, 2024, after the market close. Here are the key numbers that we’re watching.
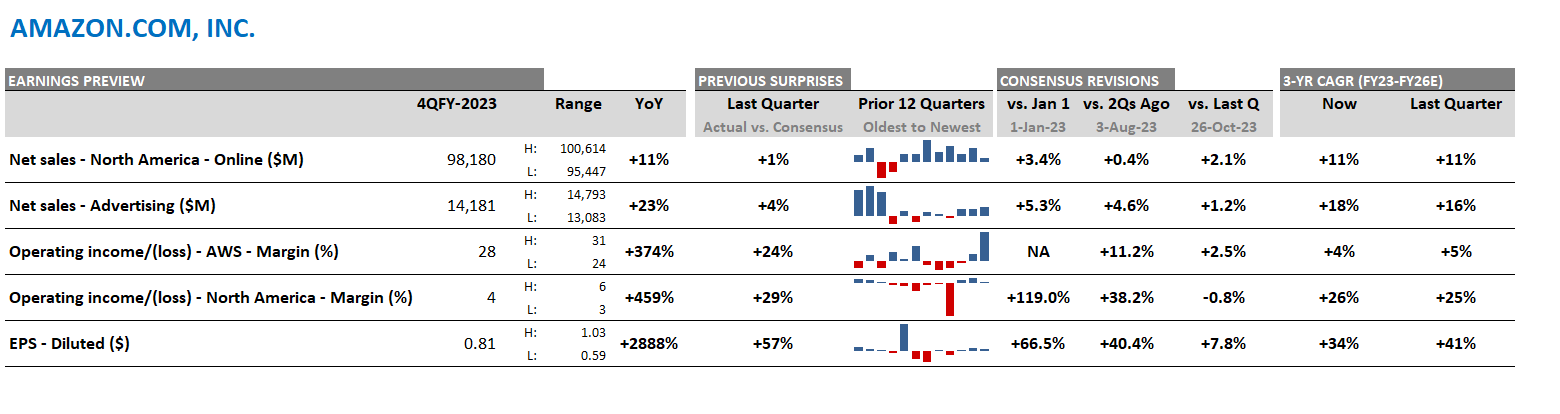
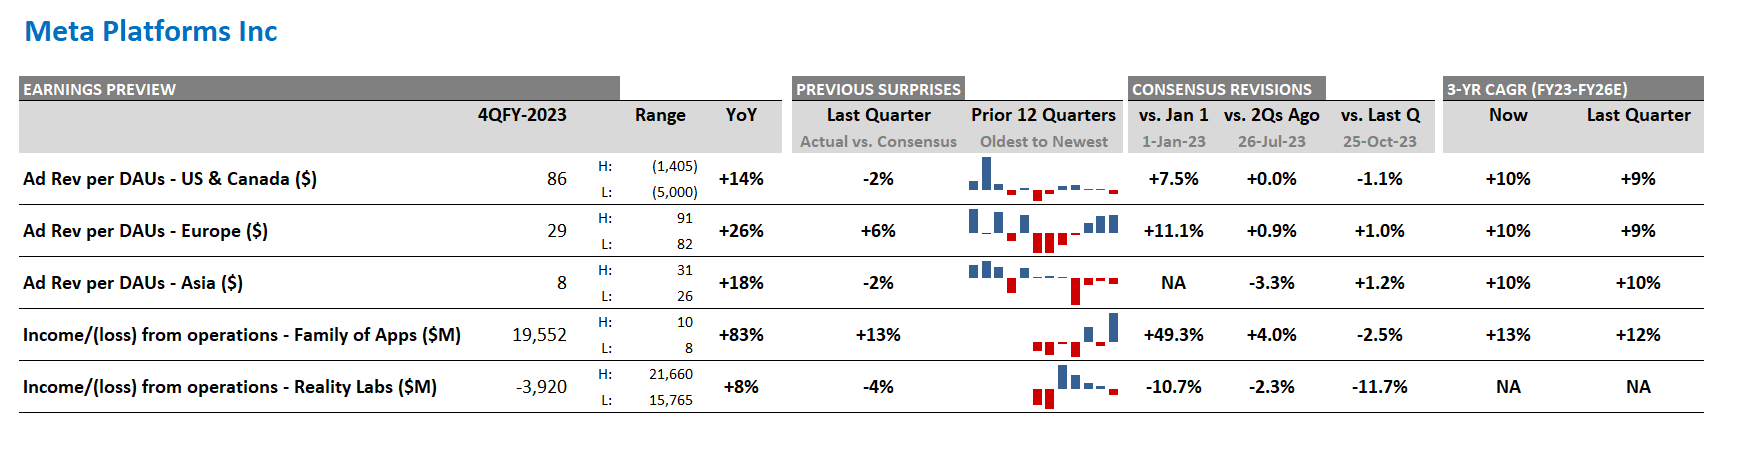
Figure 1: Nvidia – consensus expectations for Q4 2024, past earnings surprises, revisions, and CAGR
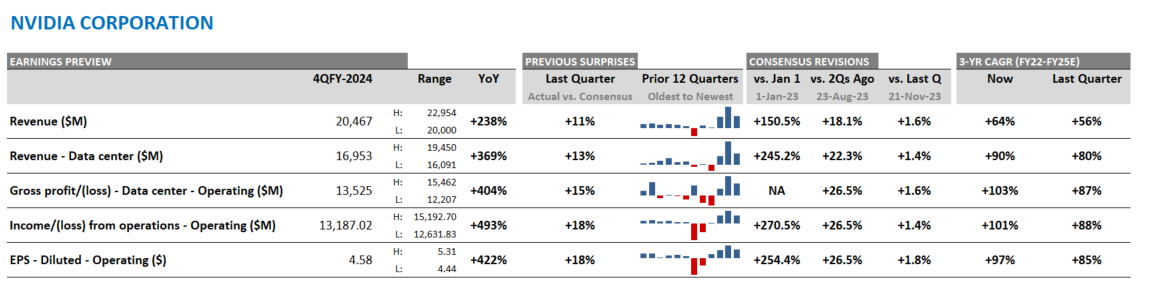
Source: Visible Alpha consensus (February 14, 2024). “Previous Surprises” indicate the direction that specific line items beat or missed. “Consensus Revisions” show the trajectory of line items from a given date.
Nvidia Q4 2024 earnings preview
According to Visible Alpha consensus, total revenues of $20.5 billion expected for Q4 2024 have not moved much from Q3 in November 2023. Overall growth continues to be driven by optimism about the strength of Nvidia’s Data Center segment. This segment has seen its expected top line performance for Q4 increase from a mere $4.9 billion in January 2023 to its current projection of $16.9 billion, up nearly 3.5x. This revenue surge has been driven by strong demand for its GPUs from Cloud Service Providers, and the move to accelerated computing in the data centers for AI.
While the pace of analysts’ upward revisions to the Data Center segment has stabilized since the Q3 release in late November, it will be important to see how Nvidia guides the market for Q1 and FY 2025, and to what extent higher pricing and volumes will be expected to continue.
Currently, there is significant debate about the performance of the Data Center segment. Based on Visible Alpha consensus, this business is projected to generate $18.3 billion in revenues in Q1 2025. For FY 2025, Visible Alpha consensus for this segment has increased an additional $5 billion to $84 billion since the Q3 release in November 2023. However, the estimates range from $65.4 billion to $121.2 billion.
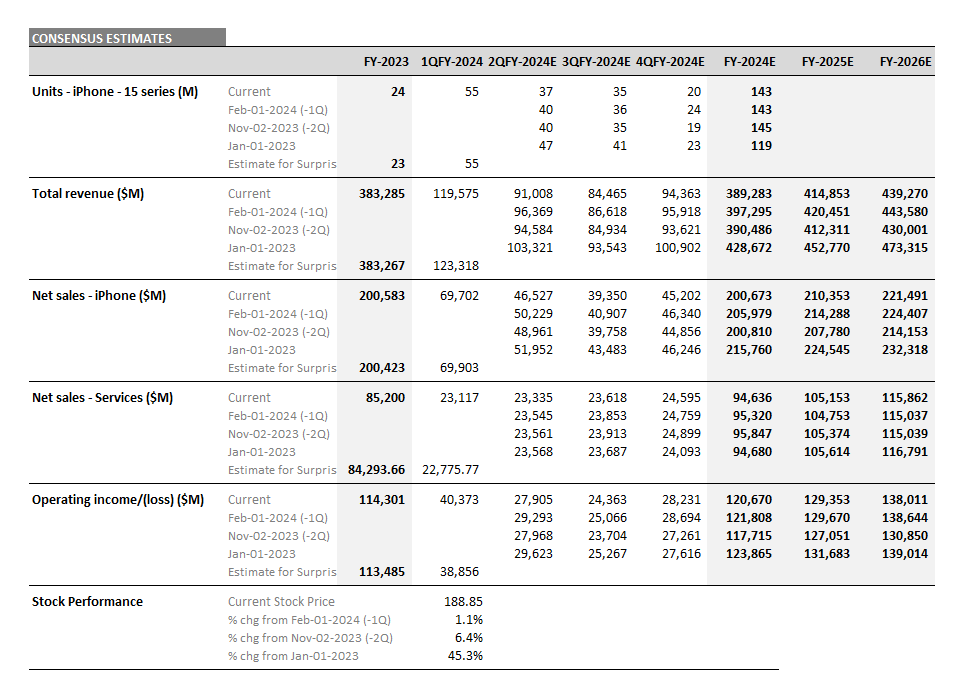
The stock has traded up an incredible 43% since last quarter’s November release, and is up nearly 400% since January 2023. Could the Q4 release provide the next positive catalyst for the stock or are the expectations largely priced in for now?
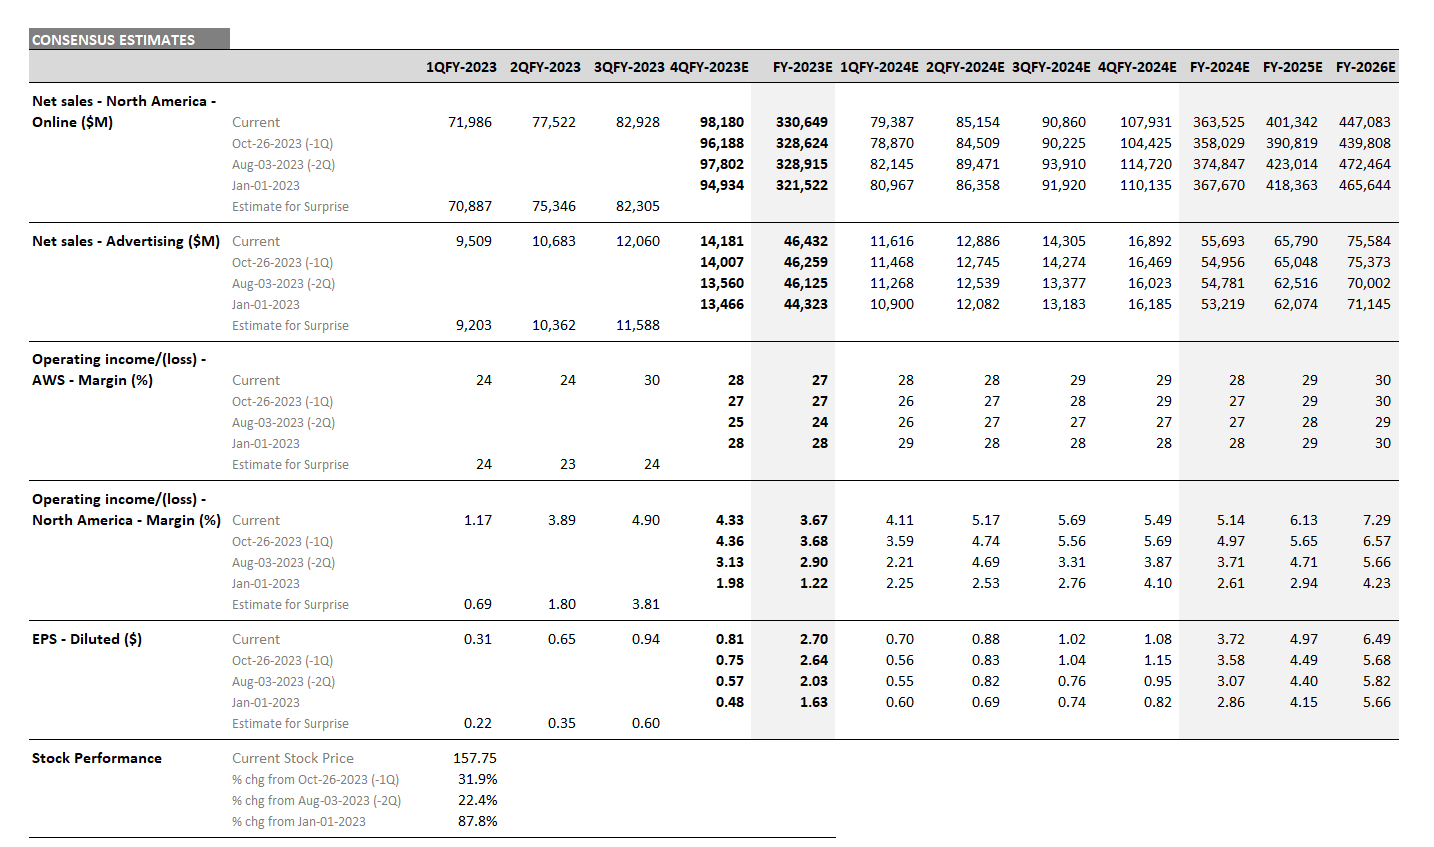
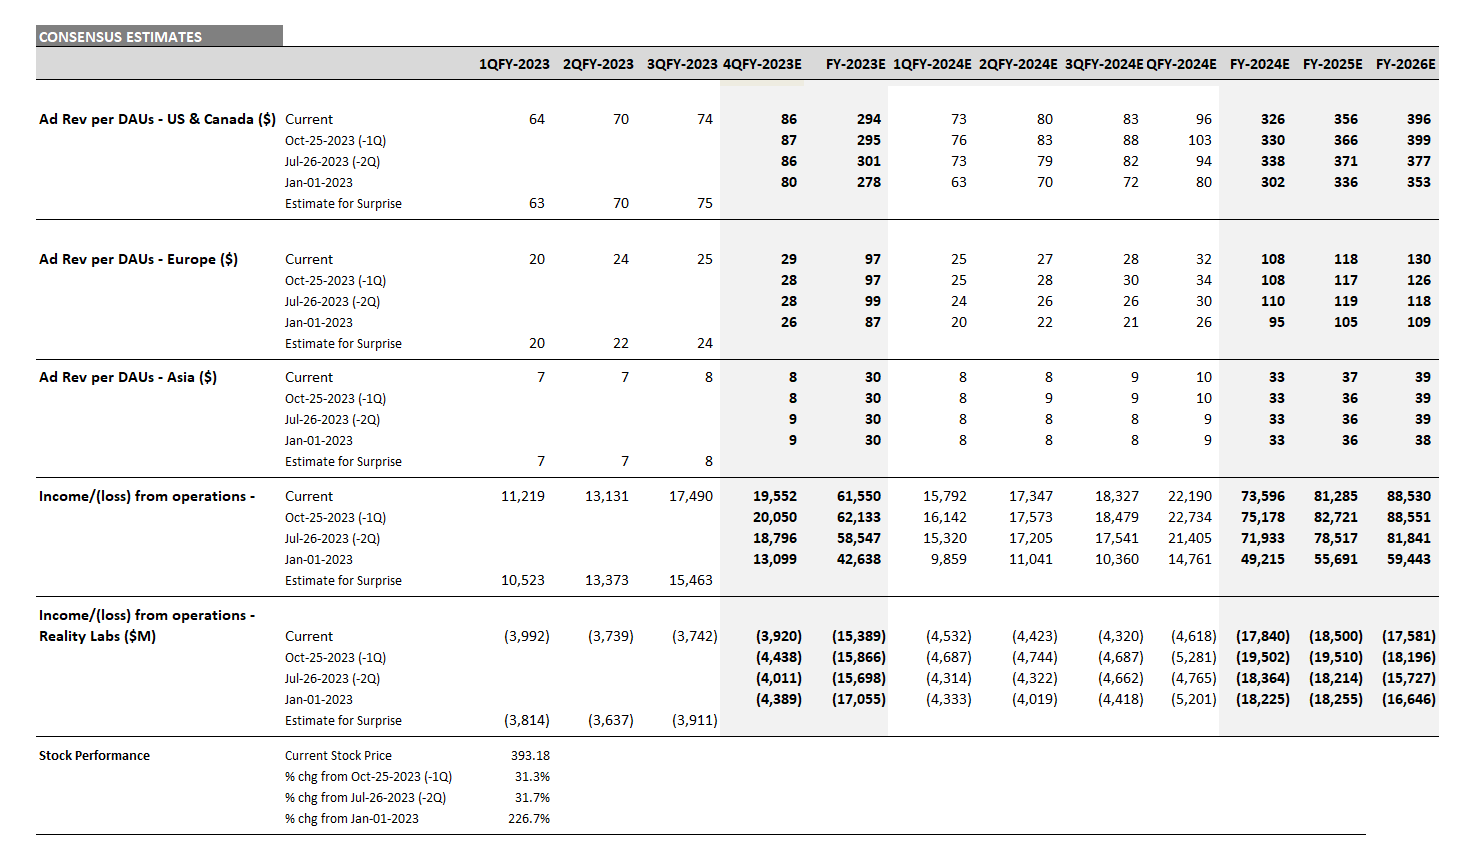
Figure 2: Nvidia consensus estimates
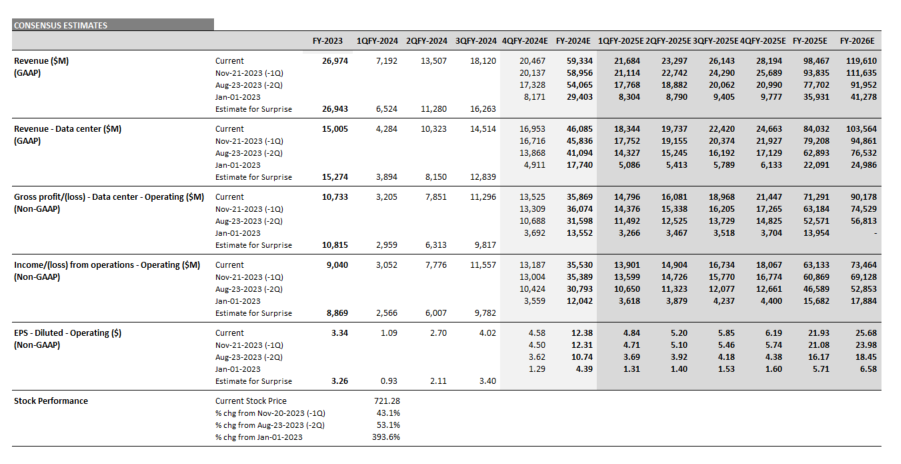
Source: Visible Alpha consensus (February 14, 2024). Stock price data courtesy of FactSet. Nvidia’s current stock price is as of the market close on February 13, 2024.
The longer-term outlook for AI
Jensen Huang, CEO of Nvidia, and Sam Altman, CEO of OpenAI, joined Omar Al Olama, the UAE’s Minister of AI, for lively discussions about the future of AI at the World Governments Summit in Dubai, UAE.
Figure 3: Nvidia CEO Jensen Huang and OpenAI CEO Sam Altman

Source: World Governments Summit in Dubai (February 12-14, 2024)
Both Altman and Huang highlighted the magnitude of this new technology cycle. Huang explained that the move to accelerated computing is what will enable AI to scale and noted that advances will help costs come down for customers. He also highlighted that Nvidia is the only platform that democratizes AI, because the CUDA architecture has the ability to adapt. CUDA’s versatility enables Nvidia to be in every cloud and every data center all the way out to the edge and to autonomous systems for robotics and self-driving cars. Altman explained that in a few more years ChatGPT will be much better than it is now, and in a decade it should be remarkable.
Huang and Altman see a significant expansion in the addressable market that should continue to benefit Nvidia and Microsoft directly. As generative AI blossoms across enterprises and, longer-term, to heavy industry, what will be the true magnitude of Data Center growth over time?
Looking ahead to FY 2026, Nvidia’s Data Center segment revenue expectations are at $103.6 billion, an increase of $57 billion from FY 2024, according to Visible Alpha consensus. However, the estimates range from $76.7 billion to $197.4 billion, a difference of over $120 billion.
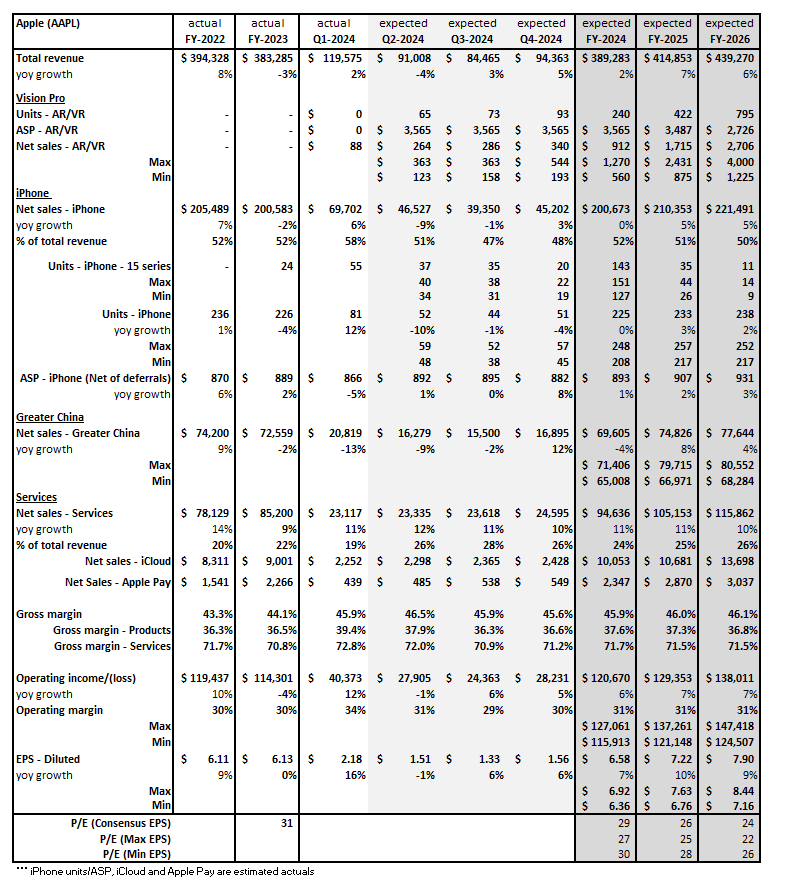
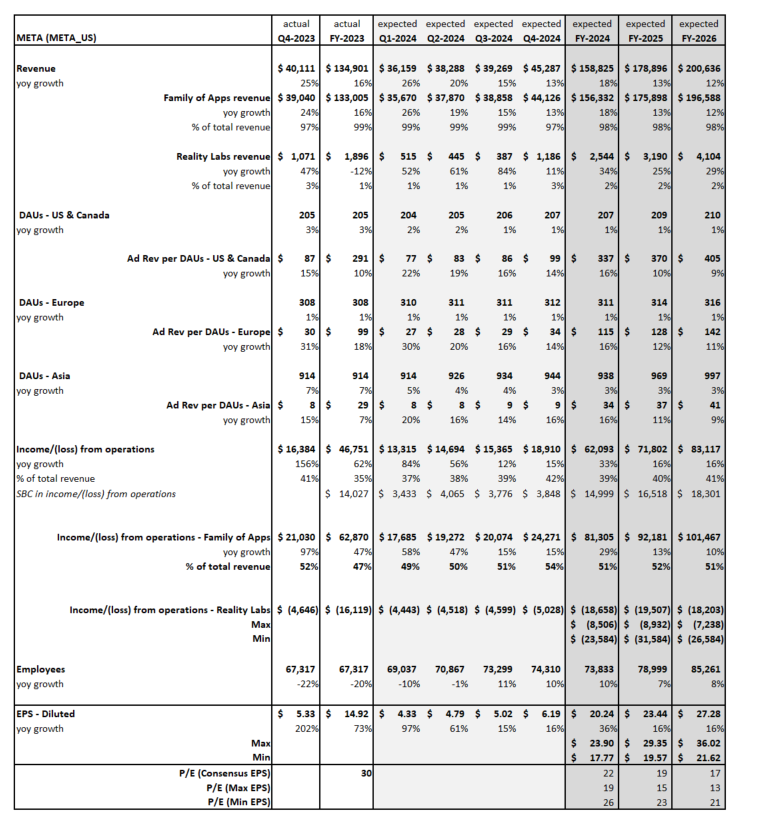
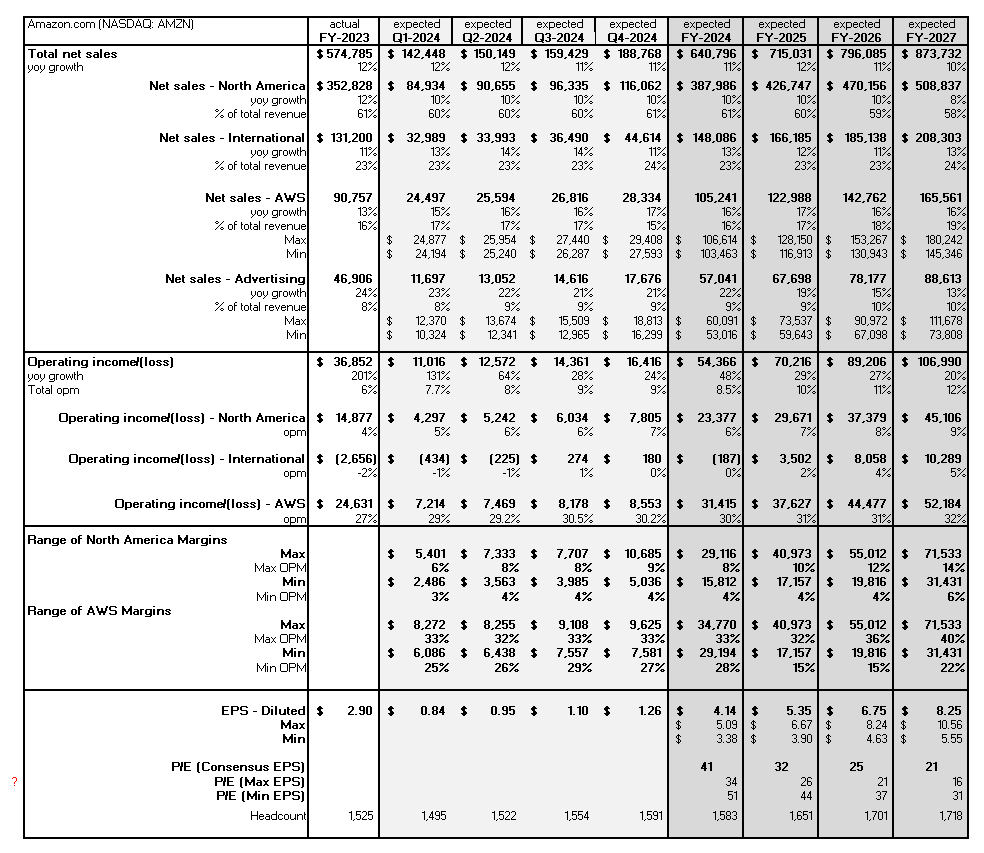
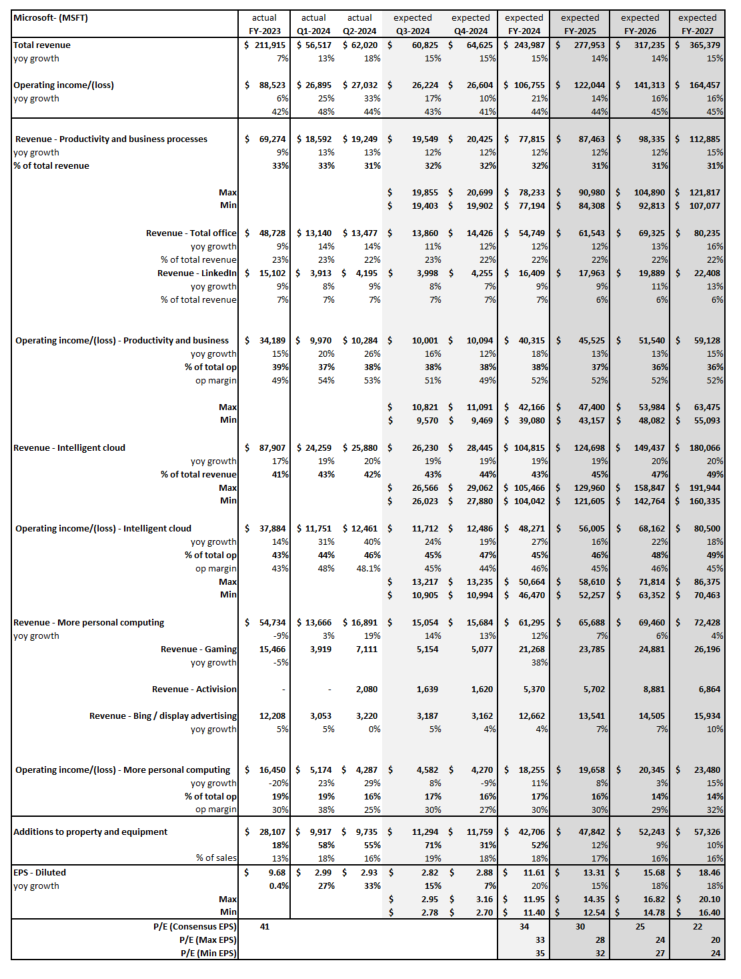
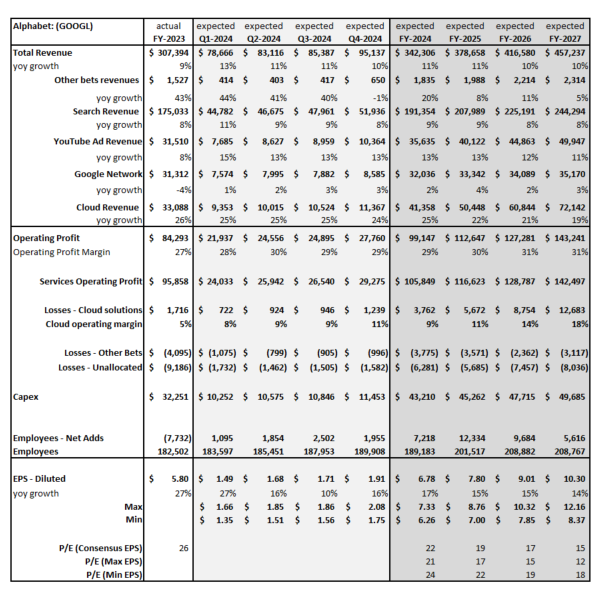
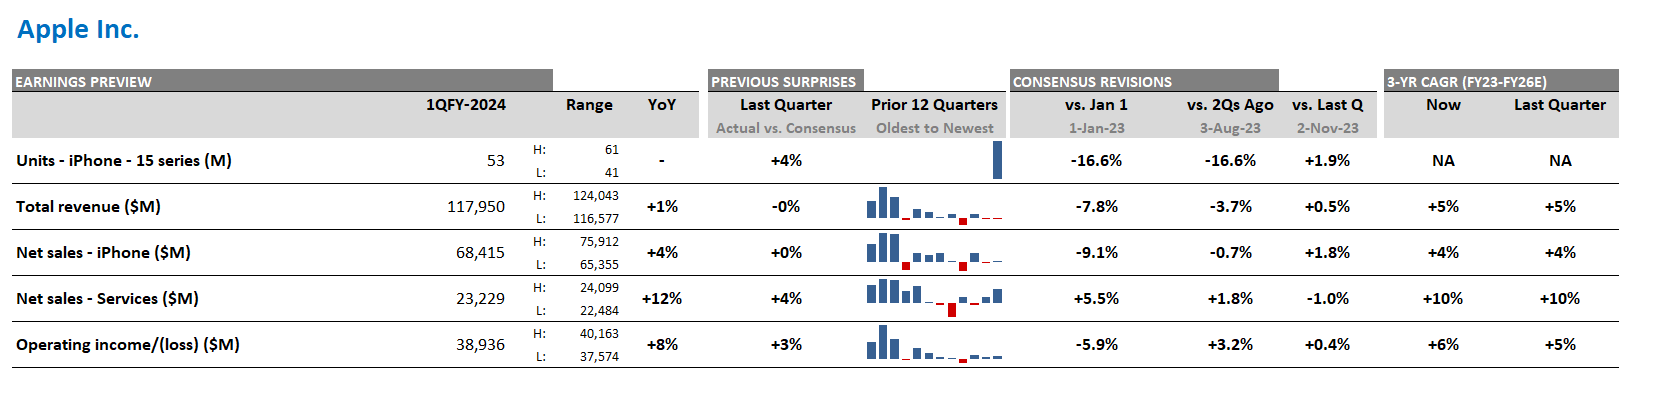
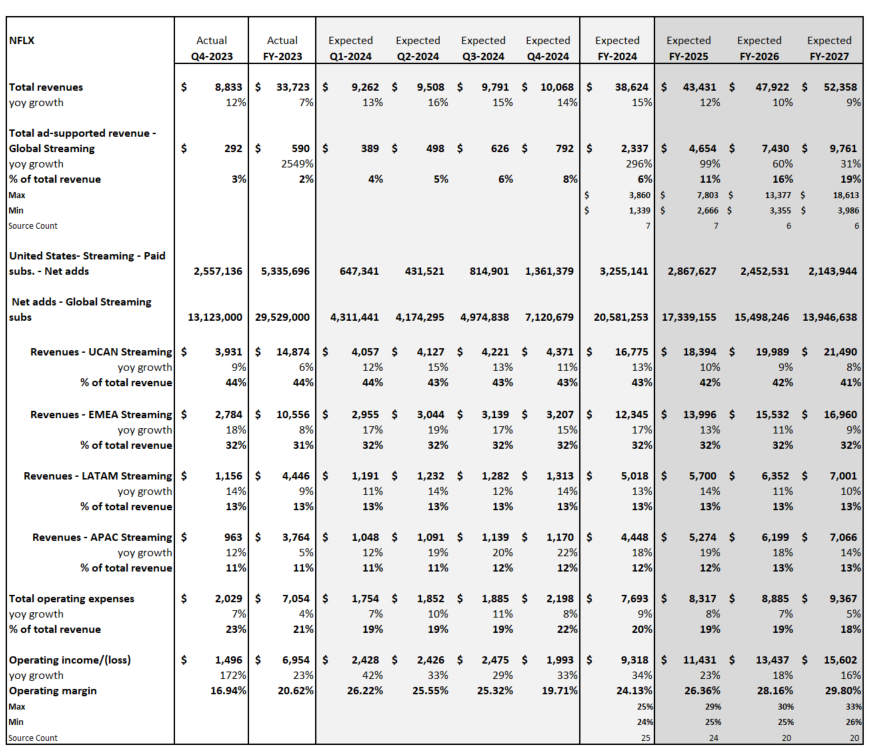
Figure 4: Nvidia’s key financial items
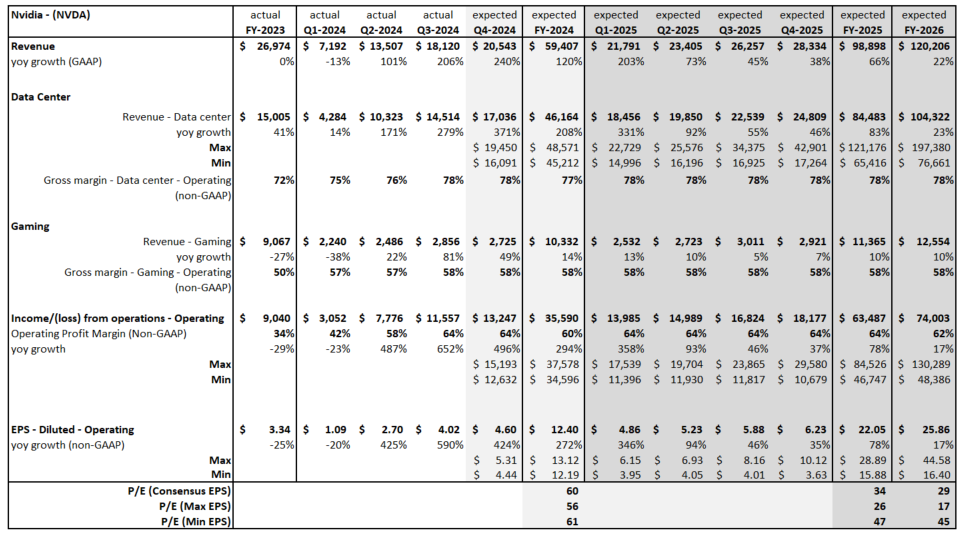
Source: Visible Alpha consensus (February 15, 2024)